| Characteristic |
English
|
Spanish
|
||||
|---|---|---|---|---|---|---|
| K N = 603 |
G1 N = 1,769 |
G2 N = 1,369 |
K N = 594 |
G1 N = 636 |
G2 N = 548 |
|
| Timepoint | ||||||
| Spring 2023 | 0 (0%) | 0 (0%) | 0 (0%) | 594 (100%) | 636 (100%) | 0 (0%) |
| Fall 2023 | 592 (98%) | 658 (37%) | 689 (50%) | 0 (0%) | 0 (0%) | 332 (61%) |
| Winter 2024 | 0 (0%) | 0 (0%) | 0 (0%) | 0 (0%) | 0 (0%) | 216 (39%) |
| Fall 2024 | 11 (1.8%) | 1,111 (63%) | 680 (50%) | 0 (0%) | 0 (0%) | 0 (0%) |
| Administration Format | ||||||
| CAT | 11 (1.8%) | 1,111 (63%) | 680 (50%) | |||
| Forms | 592 (98%) | 658 (37%) | 689 (50%) | 594 (100%) | 636 (100%) | 548 (100%) |
| Race | ||||||
| American/Alaskan Native | 15 (2.5%) | 63 (3.6%) | 26 (2.0%) | 9 (1.6%) | 7 (1.2%) | 3 (0.5%) |
| Asian | 73 (12%) | 166 (9.6%) | 132 (10%) | 7 (1.2%) | 6 (1.0%) | 5 (0.9%) |
| Black/African American | 73 (12%) | 190 (11%) | 163 (12%) | 5 (0.9%) | 4 (0.7%) | 3 (0.5%) |
| Not reported | 131 (22%) | 303 (17%) | 230 (18%) | 357 (63%) | 381 (63%) | 353 (65%) |
| Other | 111 (19%) | 257 (15%) | 138 (11%) | 46 (8.1%) | 48 (7.9%) | 24 (4.4%) |
| White | 190 (32%) | 755 (44%) | 616 (47%) | 141 (25%) | 161 (27%) | 159 (29%) |
| Unknown | 10 | 35 | 64 | 29 | 29 | 1 |
| Ethnicity | ||||||
| Hispanic/Latin(o/a) | 325 (54%) | 1,180 (69%) | 839 (65%) | 516 (97%) | 549 (97%) | 503 (94%) |
| Intentional nonreport | 10 (1.7%) | 6 (0.4%) | 3 (0.2%) | 0 (0%) | 1 (0.2%) | 2 (0.4%) |
| Not Hispanic/Latin(o/a) | 262 (44%) | 521 (31%) | 447 (35%) | 15 (2.8%) | 18 (3.2%) | 30 (5.6%) |
| Unknown | 6 | 62 | 80 | 63 | 68 | 13 |
| Gender | ||||||
| Female | 306 (51%) | 880 (52%) | 636 (49%) | 314 (59%) | 339 (60%) | 297 (54%) |
| Male | 292 (49%) | 804 (48%) | 649 (51%) | 222 (41%) | 229 (40%) | 250 (46%) |
| Non-binary | 0 (0%) | 0 (0%) | 0 (0%) | 0 (0%) | 0 (0%) | 1 (0.2%) |
| Unknown | 5 | 85 | 84 | 58 | 68 | 0 |
| Home Language | ||||||
| English | 413 (70%) | 925 (55%) | 791 (63%) | 76 (13%) | 74 (12%) | 50 (9.2%) |
| Spanish | 110 (19%) | 660 (40%) | 373 (30%) | 473 (84%) | 525 (87%) | 484 (89%) |
| Other | 63 (11%) | 83 (5.0%) | 91 (7.3%) | 16 (2.8%) | 6 (1.0%) | 7 (1.3%) |
| Unknown | 17 | 101 | 114 | 29 | 31 | 7 |
| English Proficiency Label | ||||||
| (Re-)Classified Proficient | 38 (7.2%) | 114 (7.2%) | 108 (8.7%) | 47 (9.5%) | 48 (8.7%) | 81 (16%) |
| English Learner | 145 (28%) | 599 (38%) | 354 (29%) | 393 (79%) | 440 (80%) | 394 (76%) |
| English-only | 342 (65%) | 878 (55%) | 776 (63%) | 57 (11%) | 61 (11%) | 44 (8.5%) |
| Unknown | 78 | 178 | 131 | 97 | 87 | 29 |
| Ever IEP/504 | 38 (8.0%) | 144 (10%) | 120 (12%) | 30 (11%) | 23 (12%) | 35 (11%) |
| Unknown | 128 | 334 | 339 | 314 | 448 | 237 |
9 Elision-Expressive
9.1 Task Description
Children hear a word and are prompted to take away part of it. They are then asked to say aloud what remains after the specified unit has been removed.
9.2 Construct
The Expressive Elision task measures phonological awareness and auditory manipulation skills. Students hear a word and are asked to delete a specific linguistic unit (compound word, syllable, or phoneme), then verbally produce the portion of the word or non-word that remains. This task requires accurate auditory processing, lexical retrieval, and articulation, providing insight into students’ phonological processing and expressive language development.
9.3 Item Development
An original list of words was derived from curricula used in both English and dual-language programs in California. The list was later extended by researchers by selecting words that fit the selection criteria presented below for Elision-Receptive and Elision-Expressive to increase the item pool.
For Elision-Receptive researchers selected words for which, when deleting a unit of language (at the word, syllable, and phoneme levels), a new word was generated. This word could then be imaged and the child could select what word was left (i.e. What is cowboy without cow?)The deleted unit of language could be located at the beginning of the word, at the end of the word, or in middle positions. To ensure phonetic representation of different sounds of the language, researchers excluded some items in which the same syllables and phonemes were repeated multiple times (e.g., syllable blends with [ɹ̠ ] and /l/ phonemes).
In the Elision-Expressive, children listen to a word, remove the designated part, and verbally produce the remaining segment of the word. The item involved a mix of real and nonwords, the location of the deletion varied as did the unit of deletion from compund word, to syllable, to phoneme.
9.4 Scoring
Dichotomous fixed response format of 0 points for incorrect responses or non-responses and 1 point for correct ones.
9.5 Calibration Samples
9.6 Psychometric Analysis
9.6.1 Basic Item Statistics
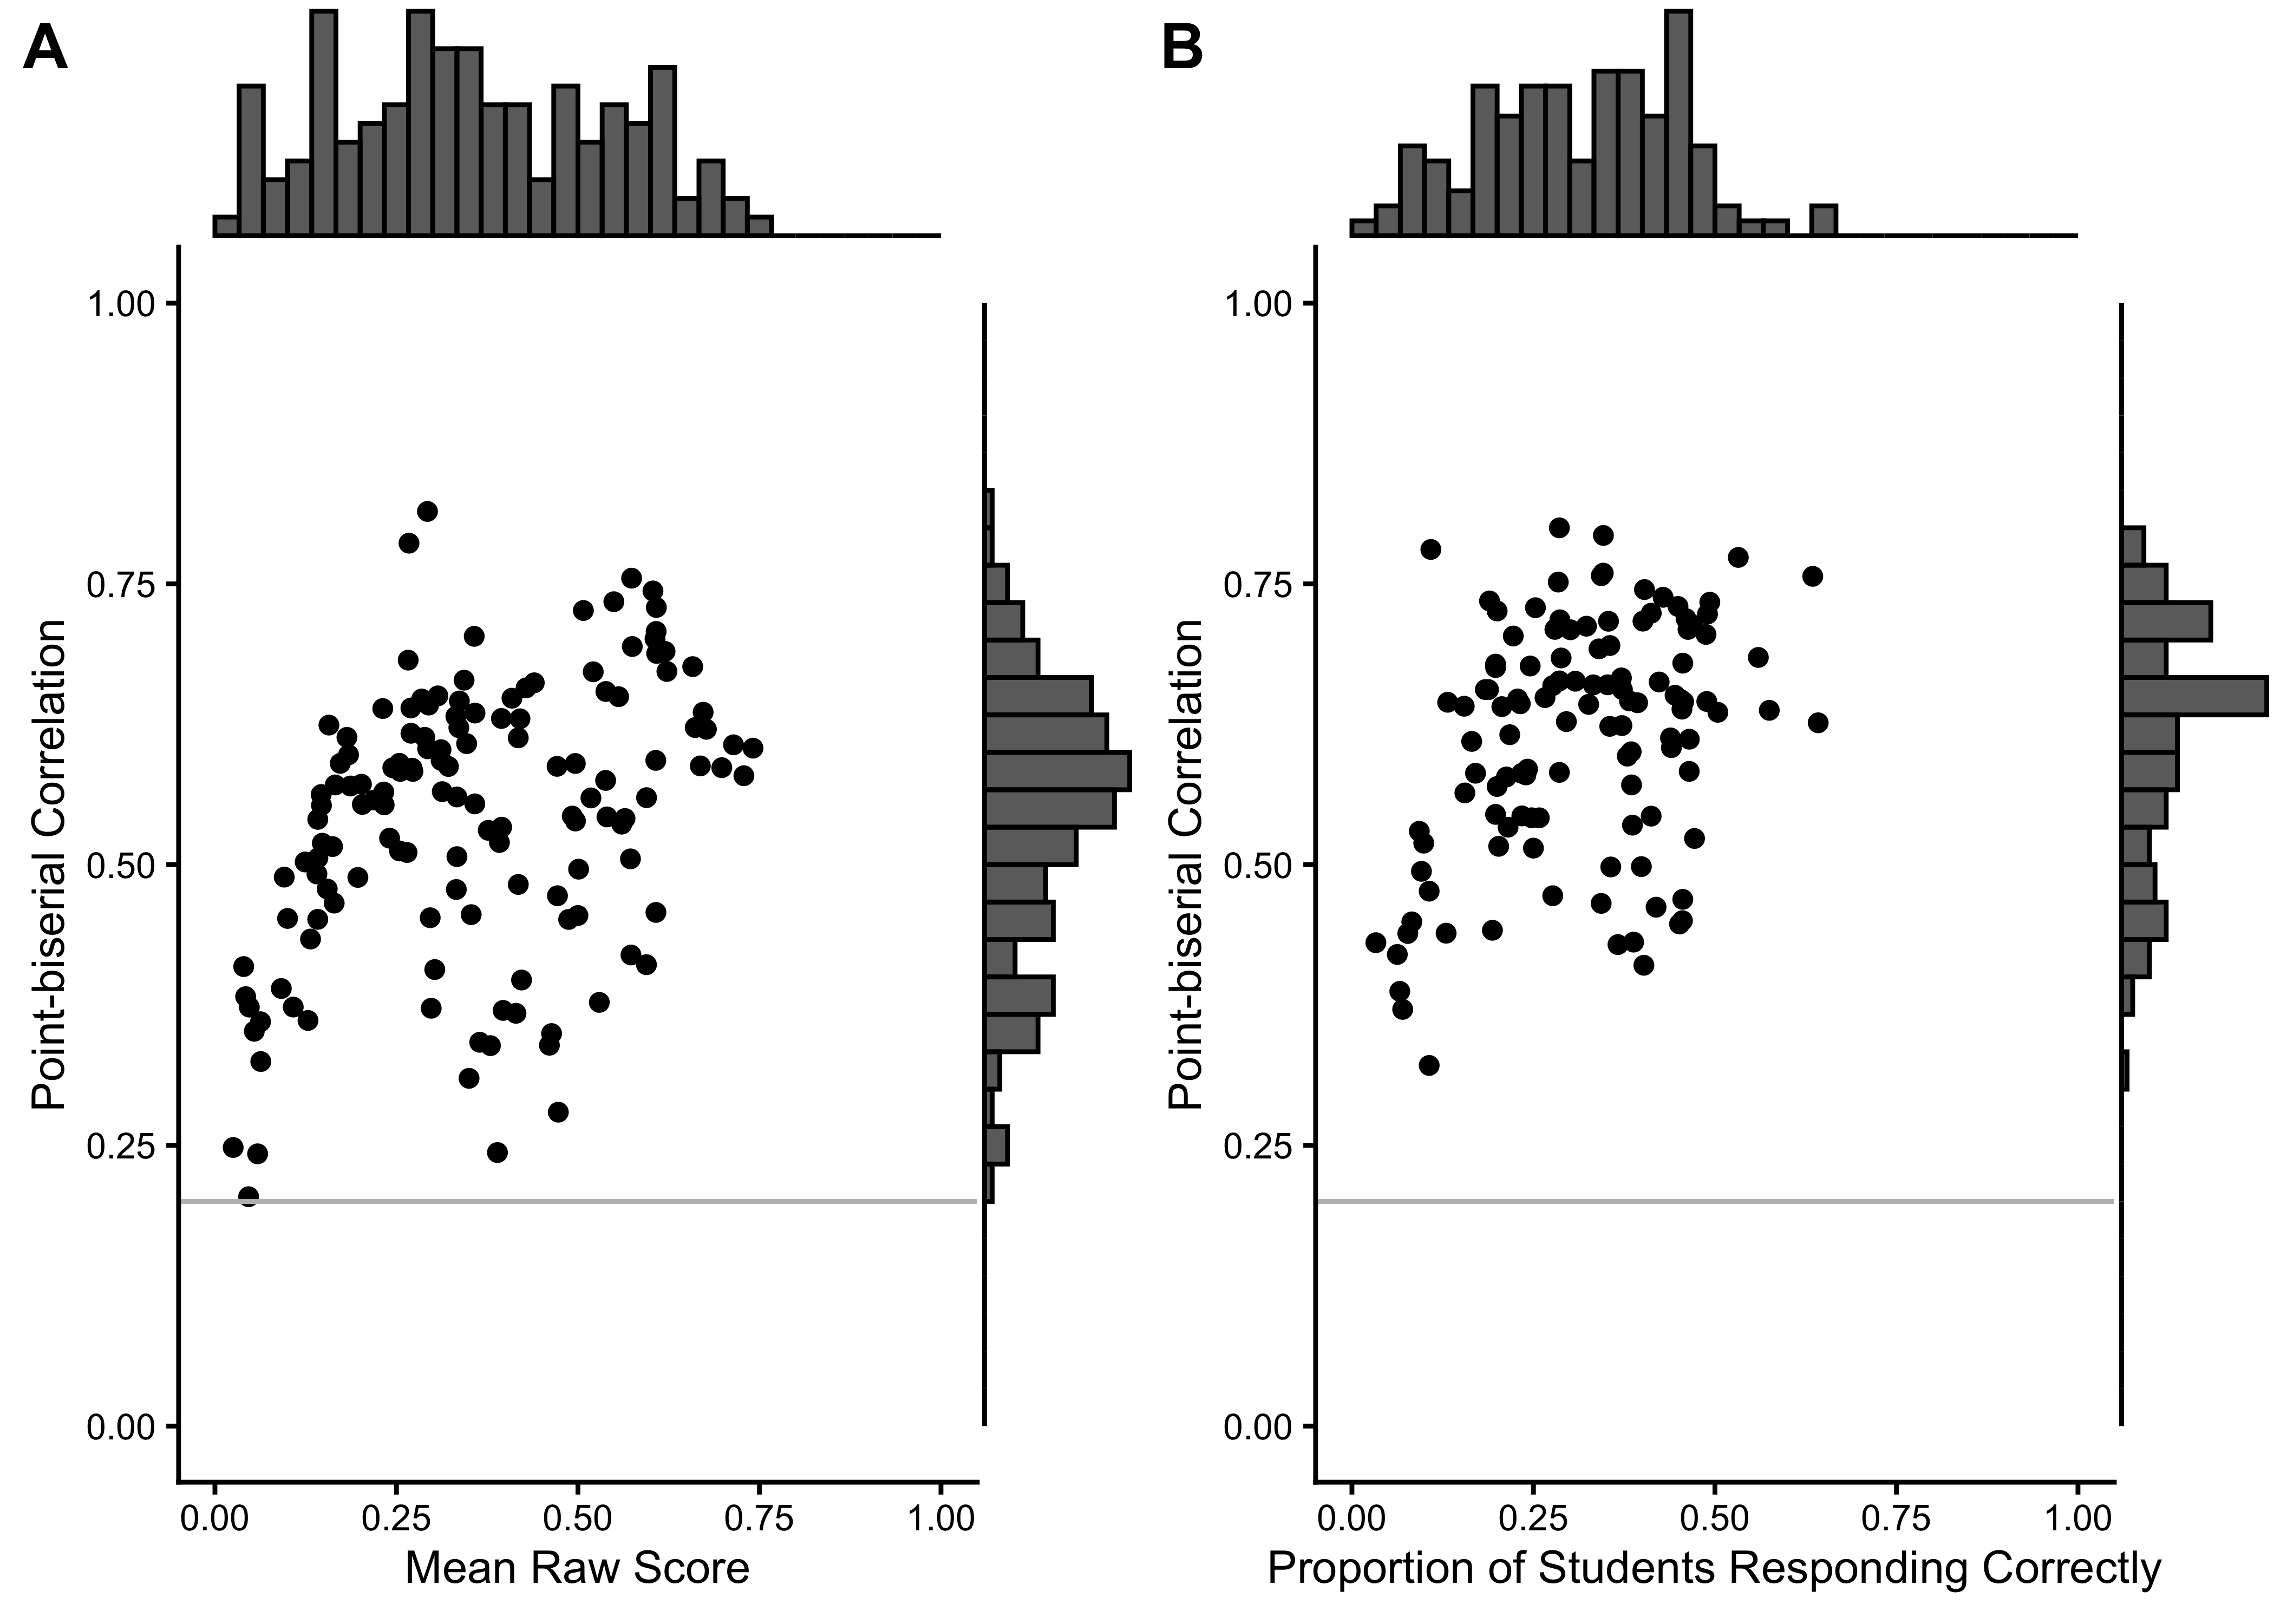
We excluded 0 items from the English task and 0 items from the Spanish task based on low response counts (n < 90). 0 items were excluded because they had no variance in the Spanish task, and 0 items in the English task. Additionally, we excluded 0 items from the English task and 0 items from the Spanish task based on low point-biserial correlations (r < 0.2). Table 9.2 summarizes the basic item characteristics, Figure 9.1 shows the relationship between point-biserial correlations and the proportion of correct responses for each item.
English
|
Spanish
|
|||
|---|---|---|---|---|
| Characteristic |
Before Excl.
|
After Excl.
|
Before Excl.
|
After Excl.
|
| N = 139 | N = 139 | N = 117 | N = 117 | |
| No. of Responses | 280 (184) | 280 (184) | 227 (176) | 227 (176) |
| Proportion Correct | 0.36 (0.18) | 0.36 (0.18) | 0.31 (0.13) | 0.31 (0.13) |
| Point-biserial Correlation | 0.54 (0.12) | 0.54 (0.12) | 0.61 (0.11) | 0.61 (0.11) |
| Excluded (n < 90) | 0 (0%) | 0 (0%) | 0 (0%) | 0 (0%) |
| Excluded (pbis < .2) | 0 (0%) | 0 (0%) | 0 (0%) | 0 (0%) |
| Excluded (no variation) | 0 (0%) | 0 (0%) | 0 (0%) | 0 (0%) |
9.6.2 Rasch Analysis
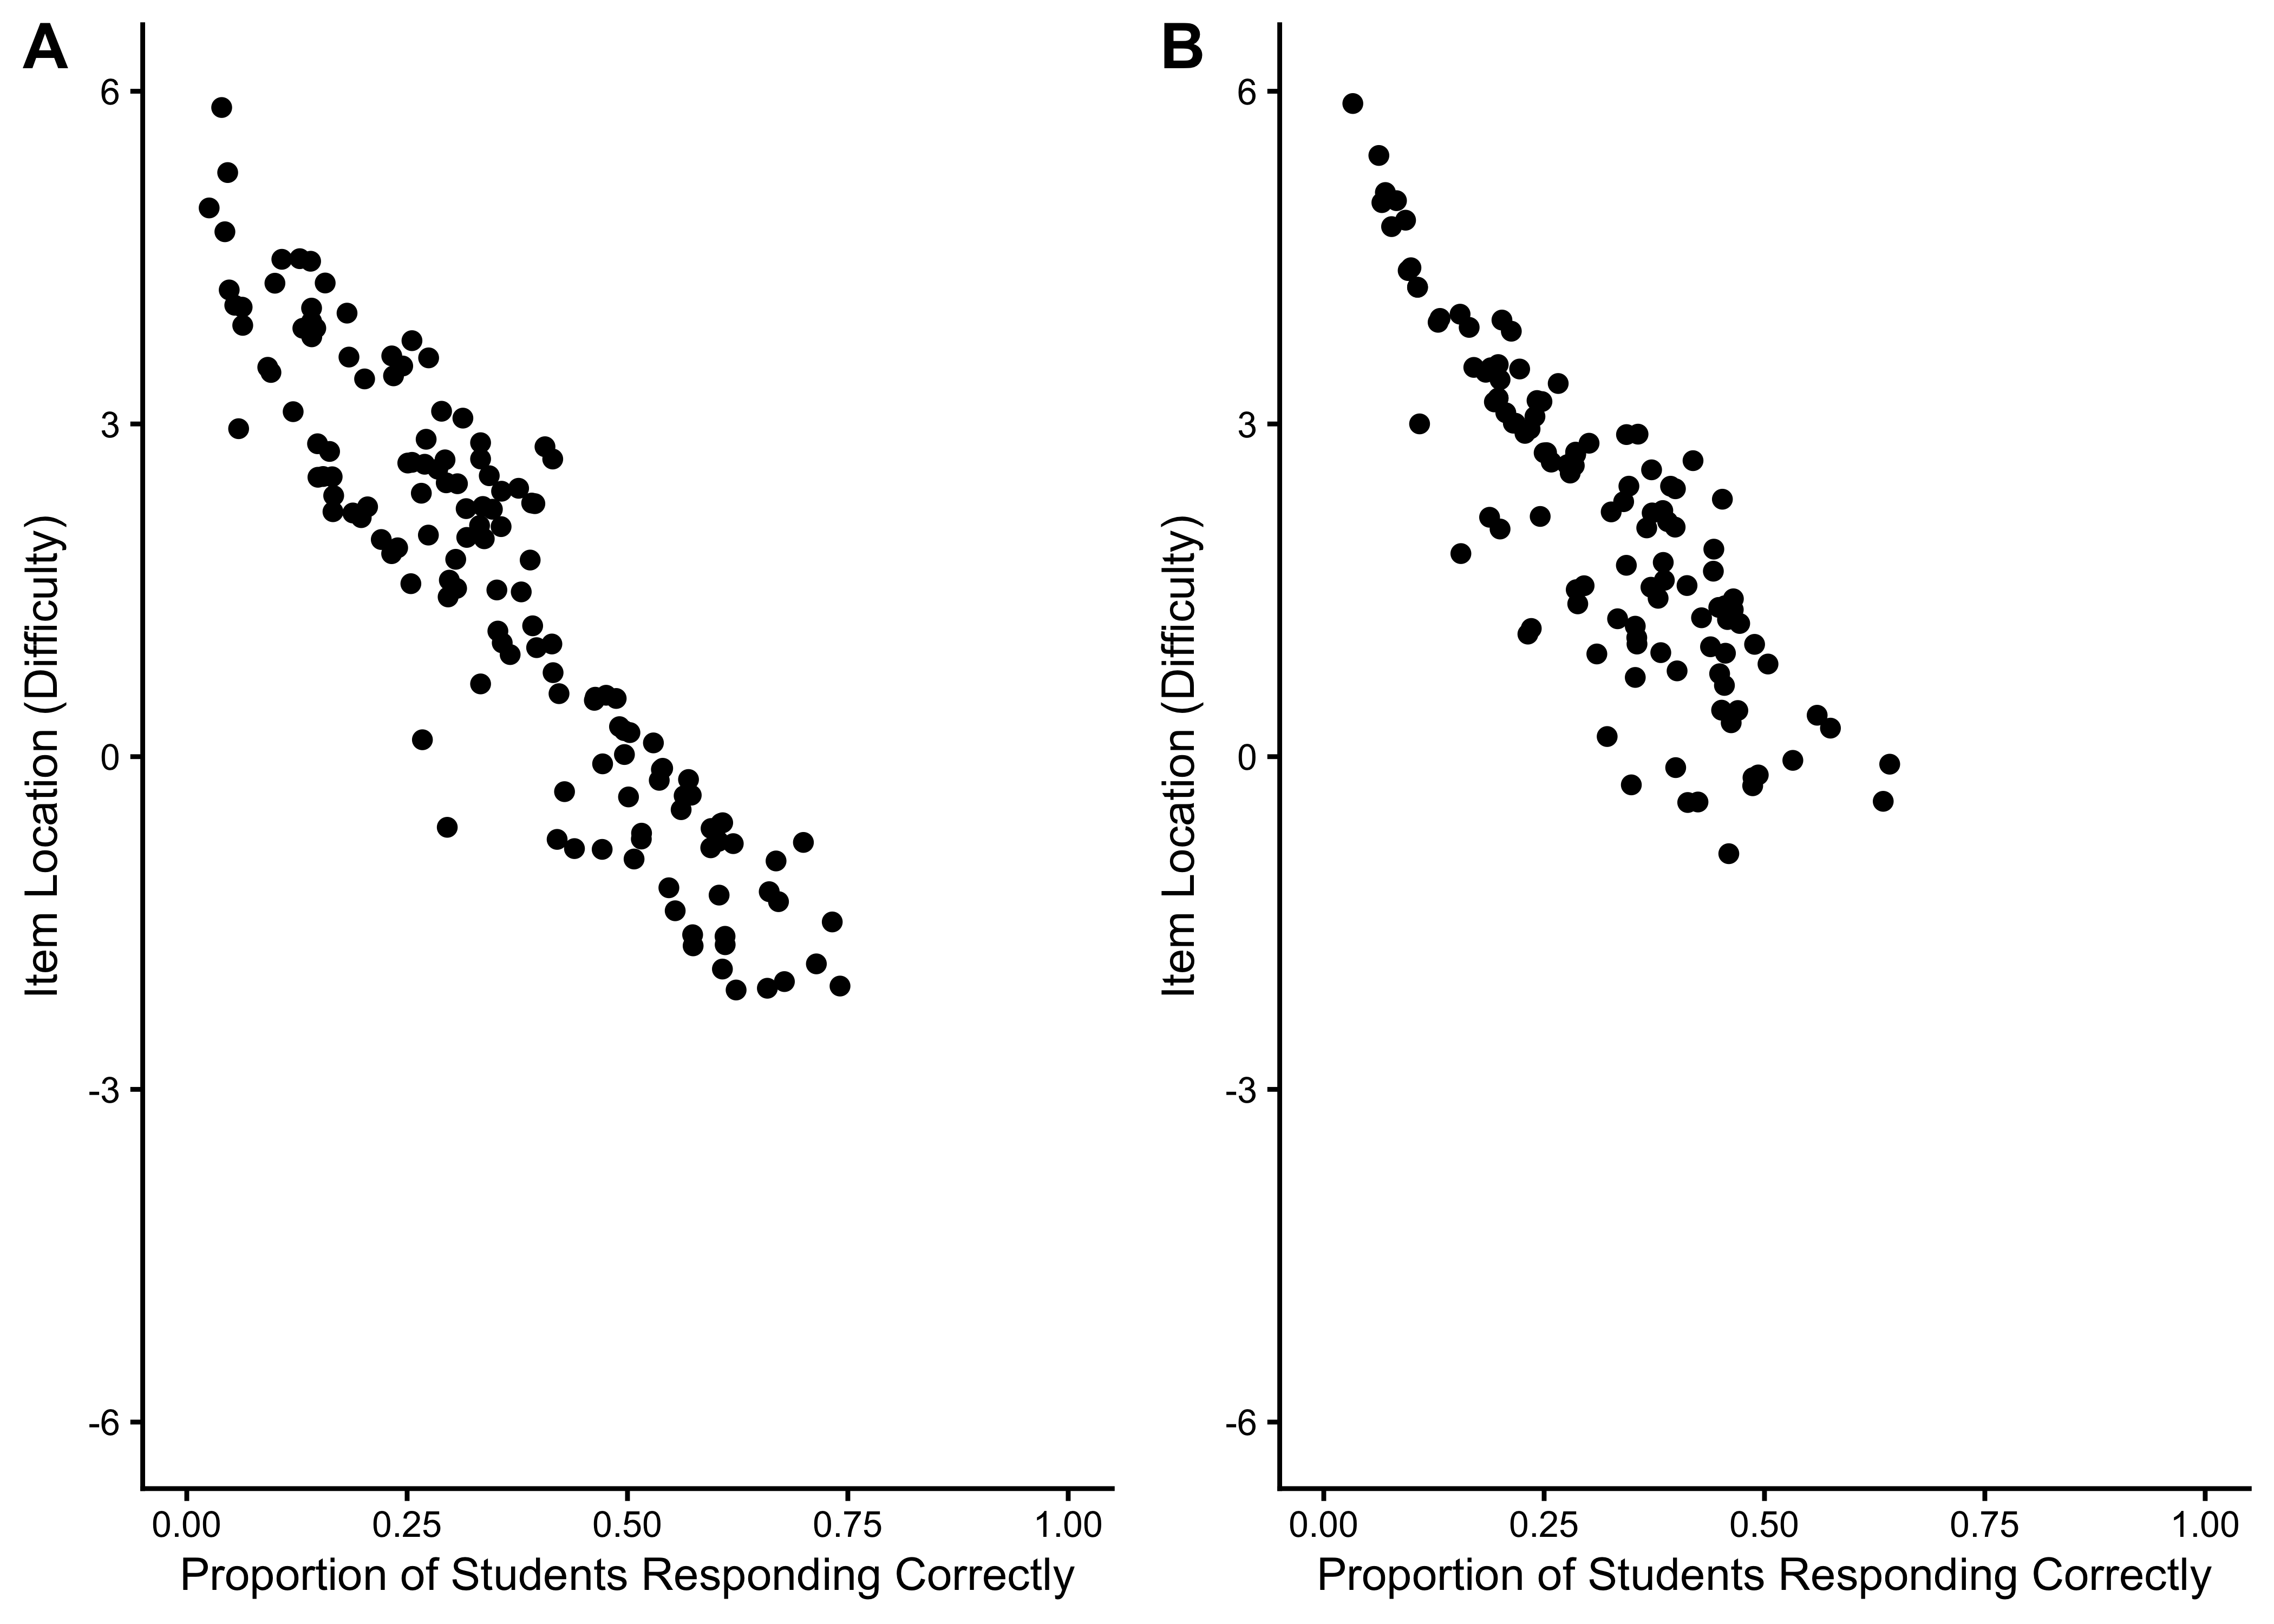
9.6.2.1 Item Location Estimates
9.6.2.2 Item Fit Statistics
| A | B | C | D | Total | A | B | C | D | Total | |
|---|---|---|---|---|---|---|---|---|---|---|
| Outfit MSE | ||||||||||
| A | 120 | 0 | 0 | 0 | 120 | 103 | 0 | 0 | 0 | 103 |
| B | 1 | 0 | 0 | 0 | 1 | 8 | 0 | 0 | 0 | 8 |
| C | 8 | 0 | 0 | 0 | 8 | 4 | 0 | 0 | 0 | 4 |
| D | 9 | 0 | 1 | 0 | 10 | 2 | 0 | 0 | 0 | 2 |
| Total | 138 | 0 | 1 | 0 | 139 | 117 | 0 | 0 | 0 | 117 |
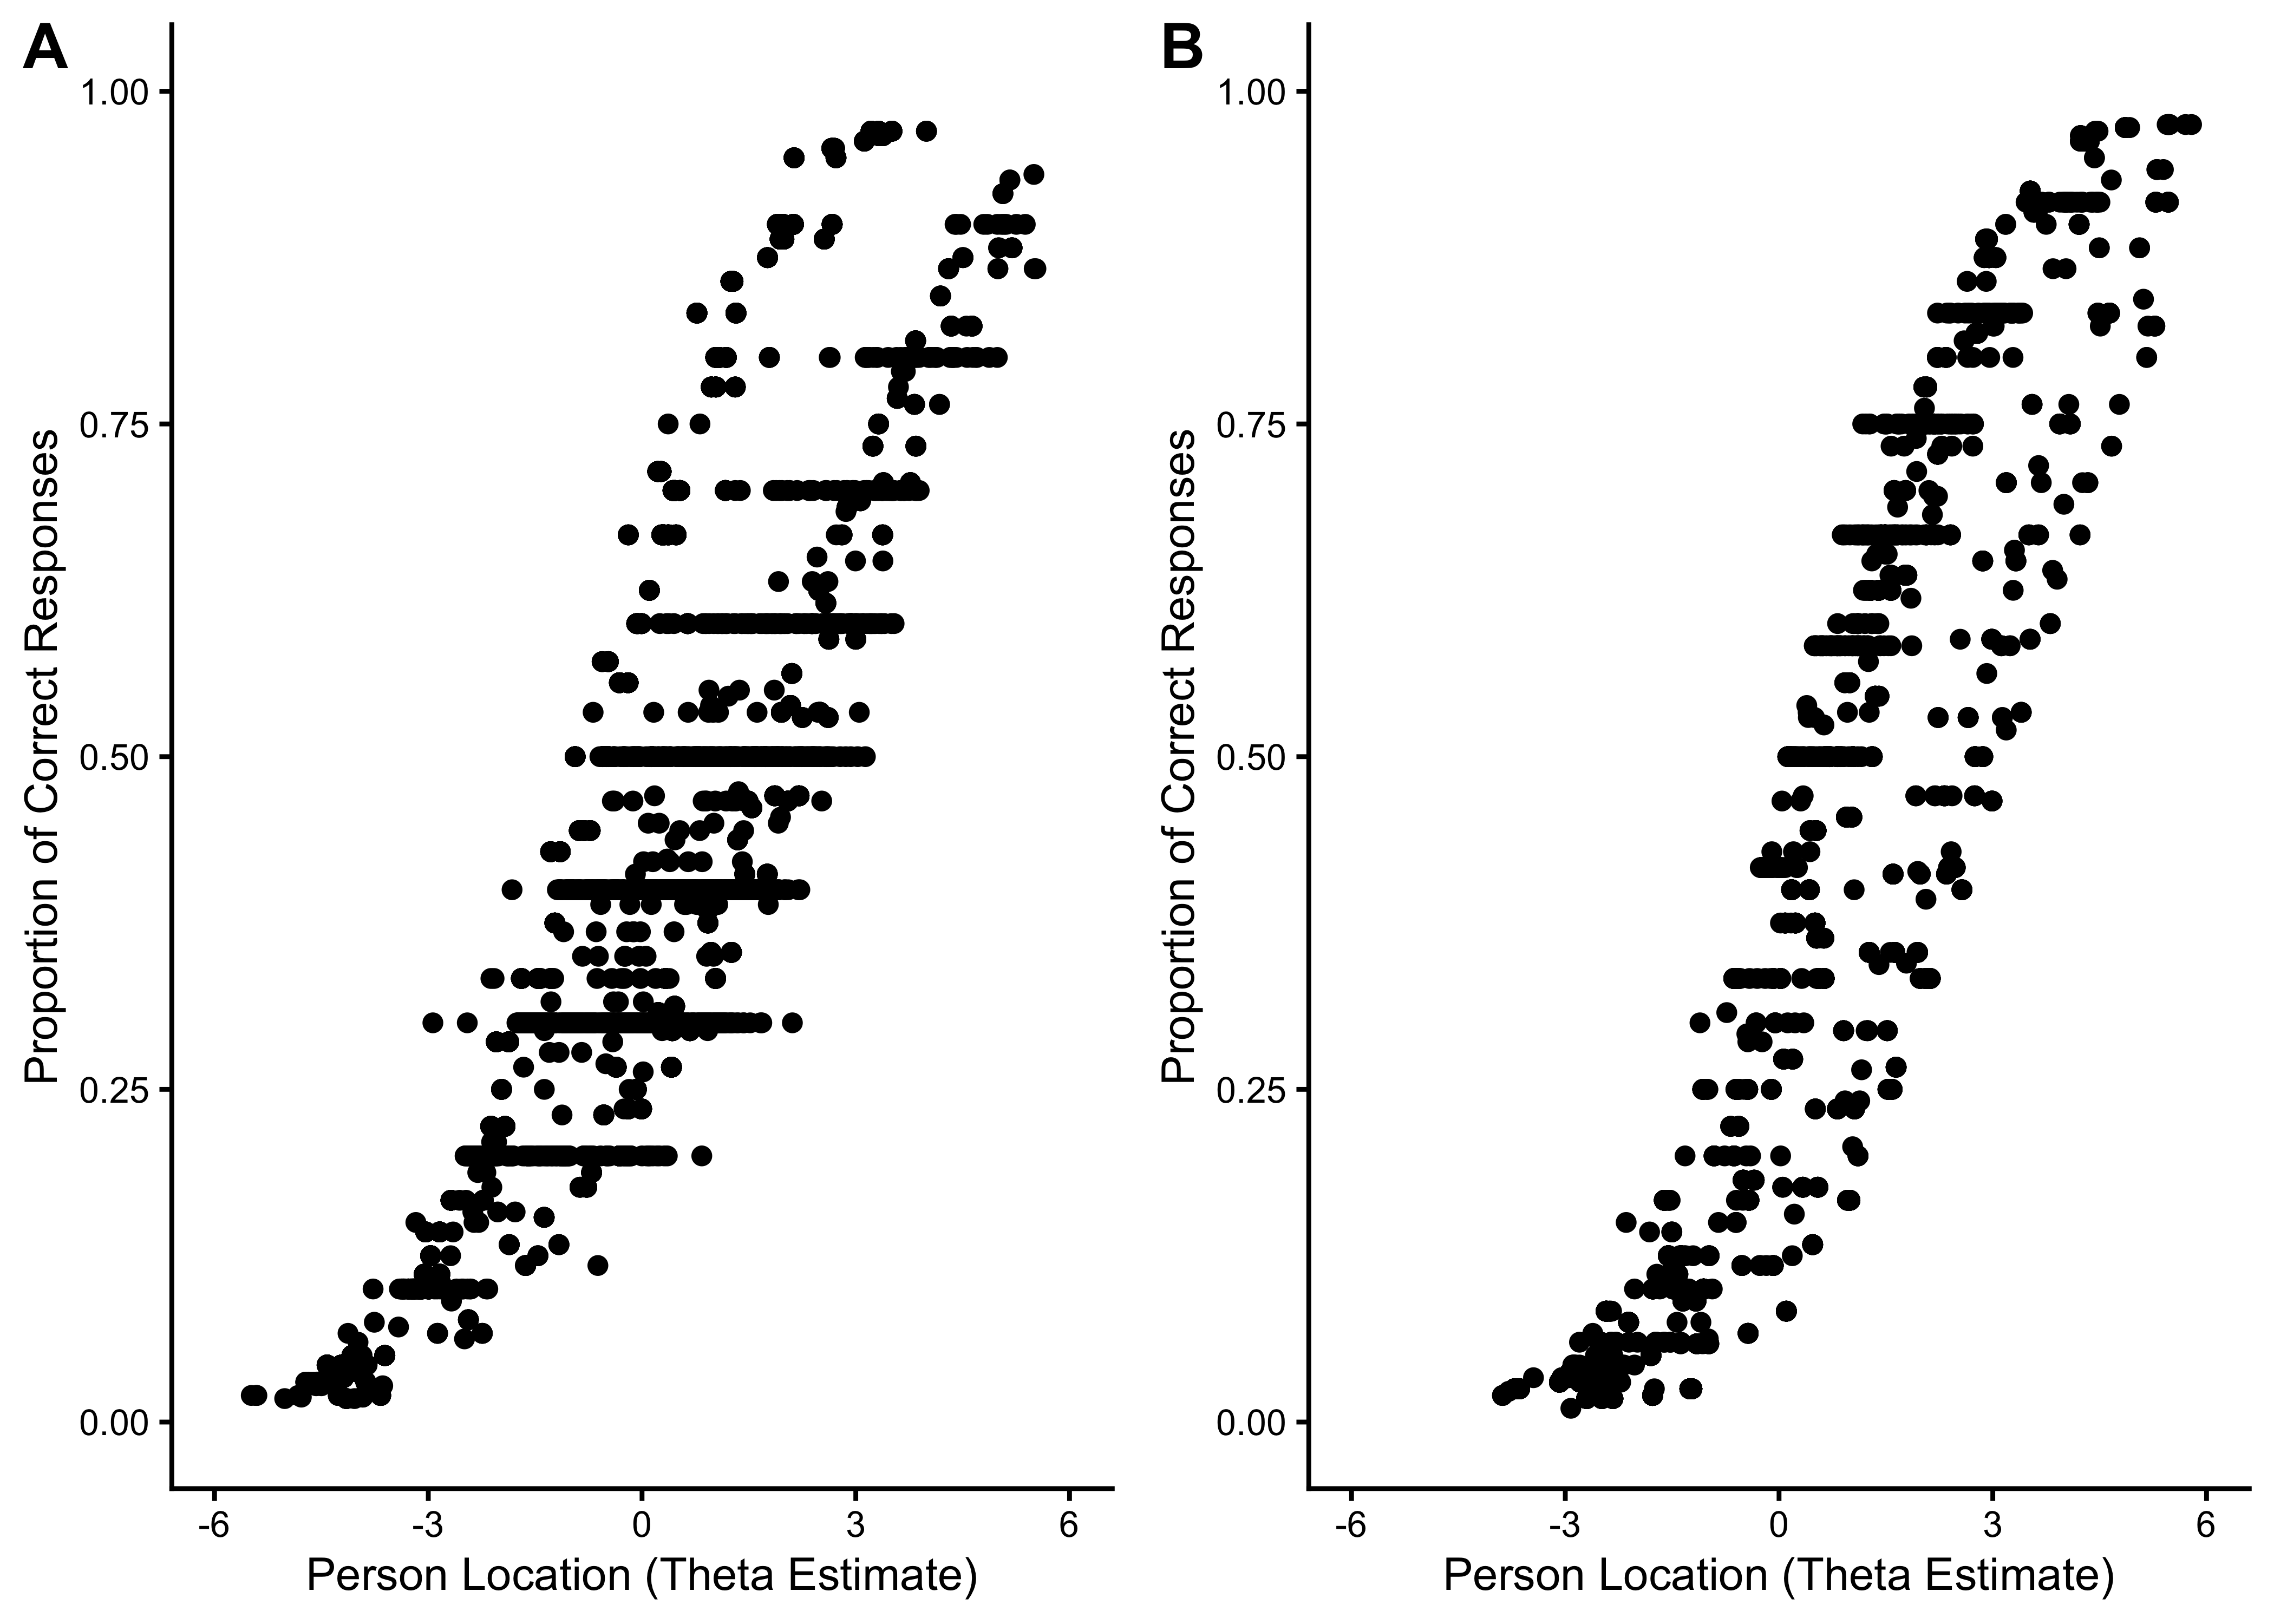
9.6.2.3 Person Location Estimates
9.6.2.4 Person Fit Statistics
| A | B | C | D | Total | A | B | C | D | Total | |
|---|---|---|---|---|---|---|---|---|---|---|
| Outfit MSE | ||||||||||
| A | 1,713 | 0 | 15 | 0 | 1,728 | 1,245 | 0 | 5 | 0 | 1,250 |
| B | 746 | 782 | 0 | 0 | 1,528 | 208 | 814 | 0 | 0 | 1,022 |
| C | 75 | 0 | 38 | 3 | 116 | 79 | 0 | 25 | 0 | 104 |
| D | 99 | 0 | 53 | 36 | 188 | 5 | 0 | 19 | 7 | 31 |
| Total | 2,633 | 782 | 106 | 39 | 3,560 | 1,537 | 814 | 49 | 7 | 2,407 |
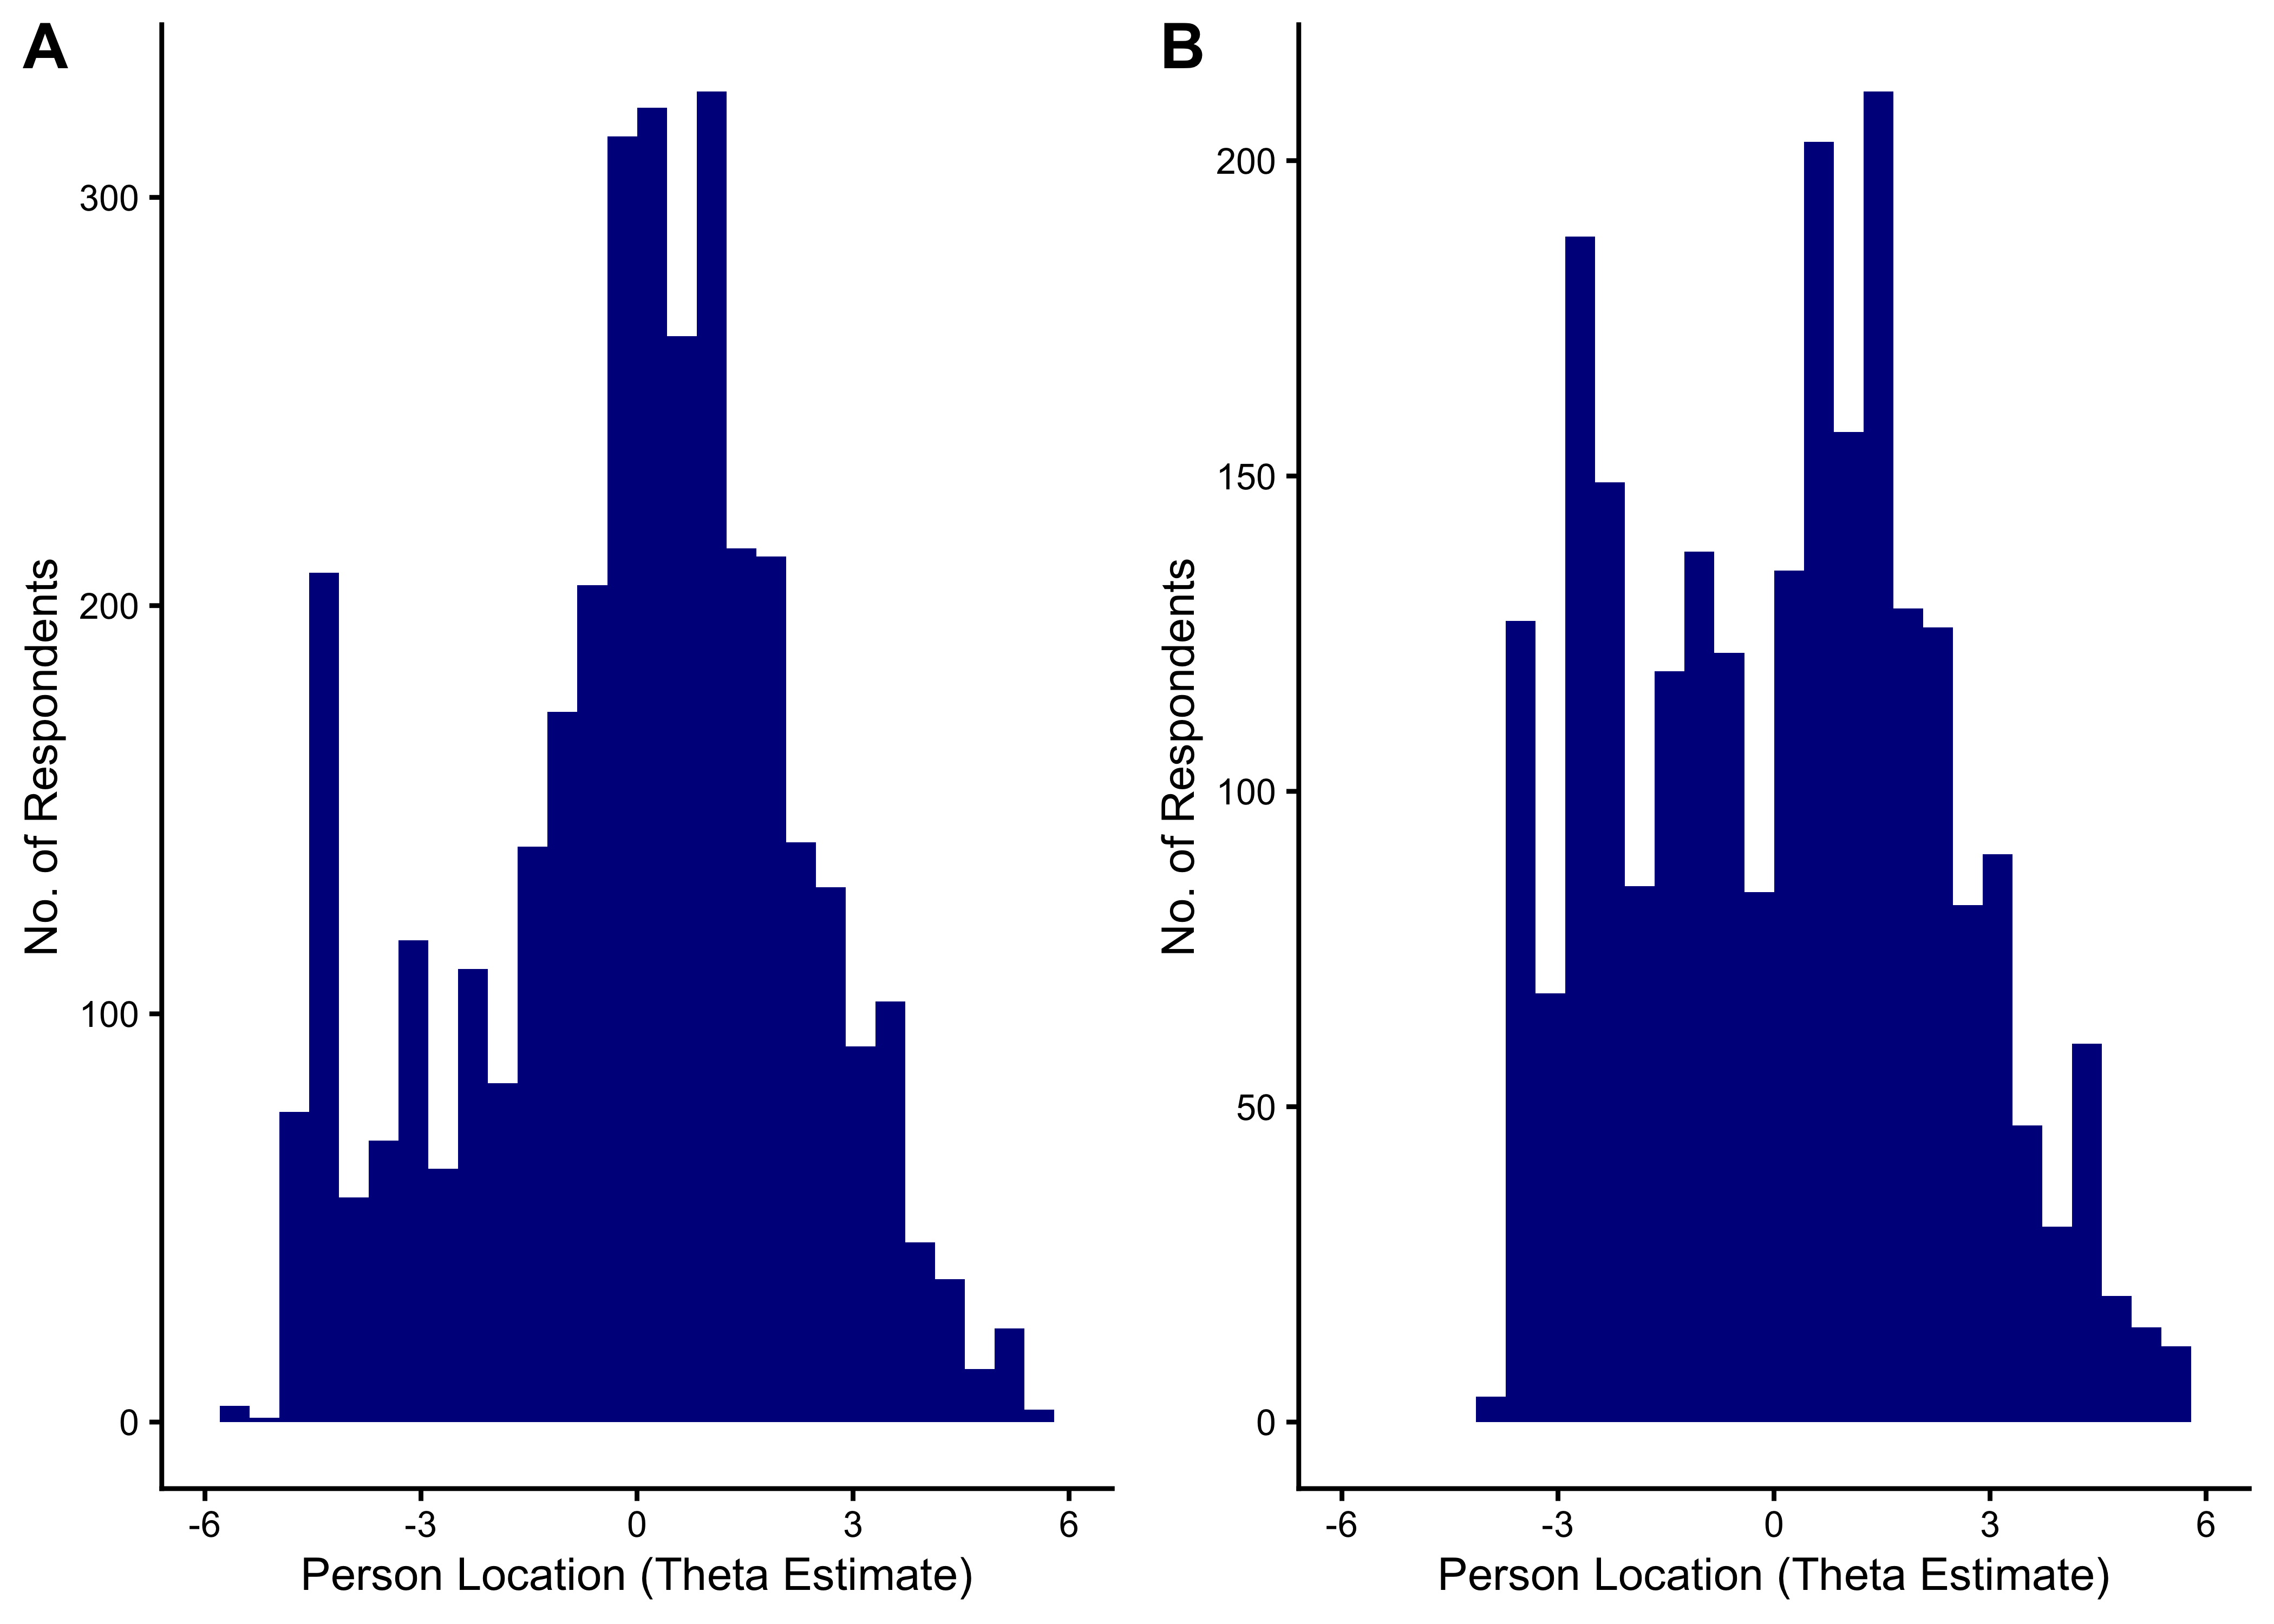
9.6.2.5 Distribution of Theta Estimates
9.6.2.6 Wright Maps
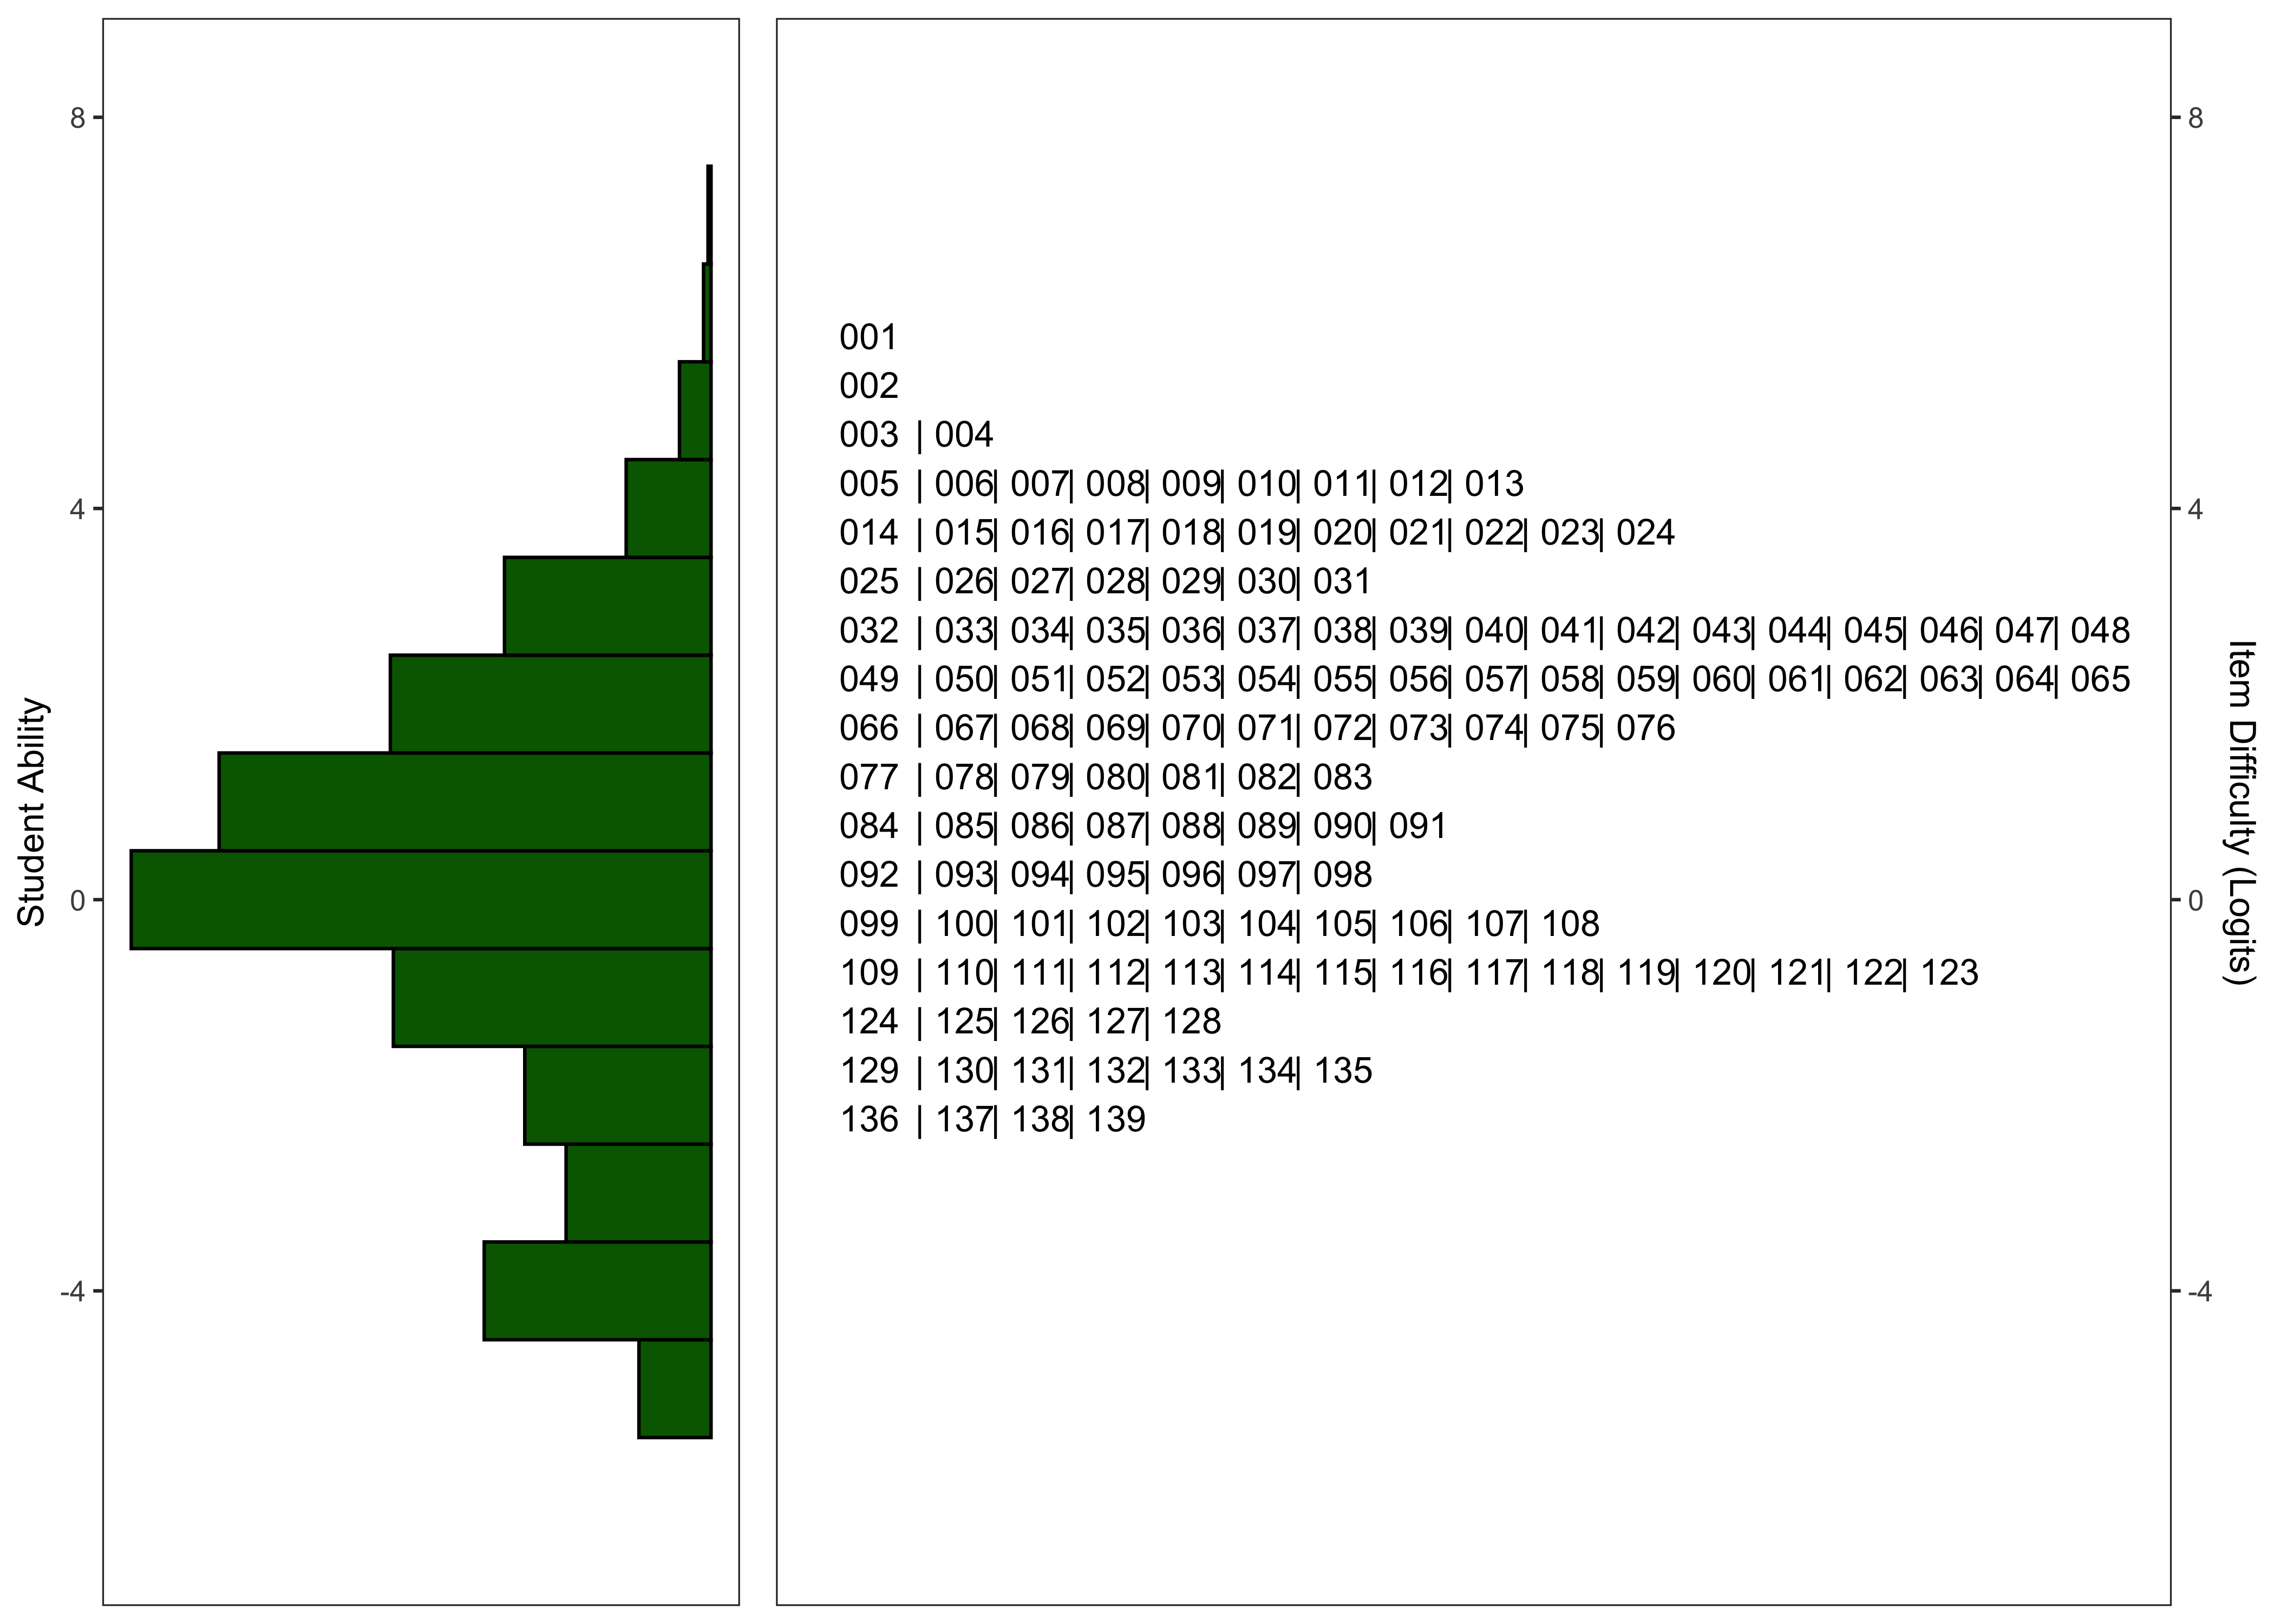
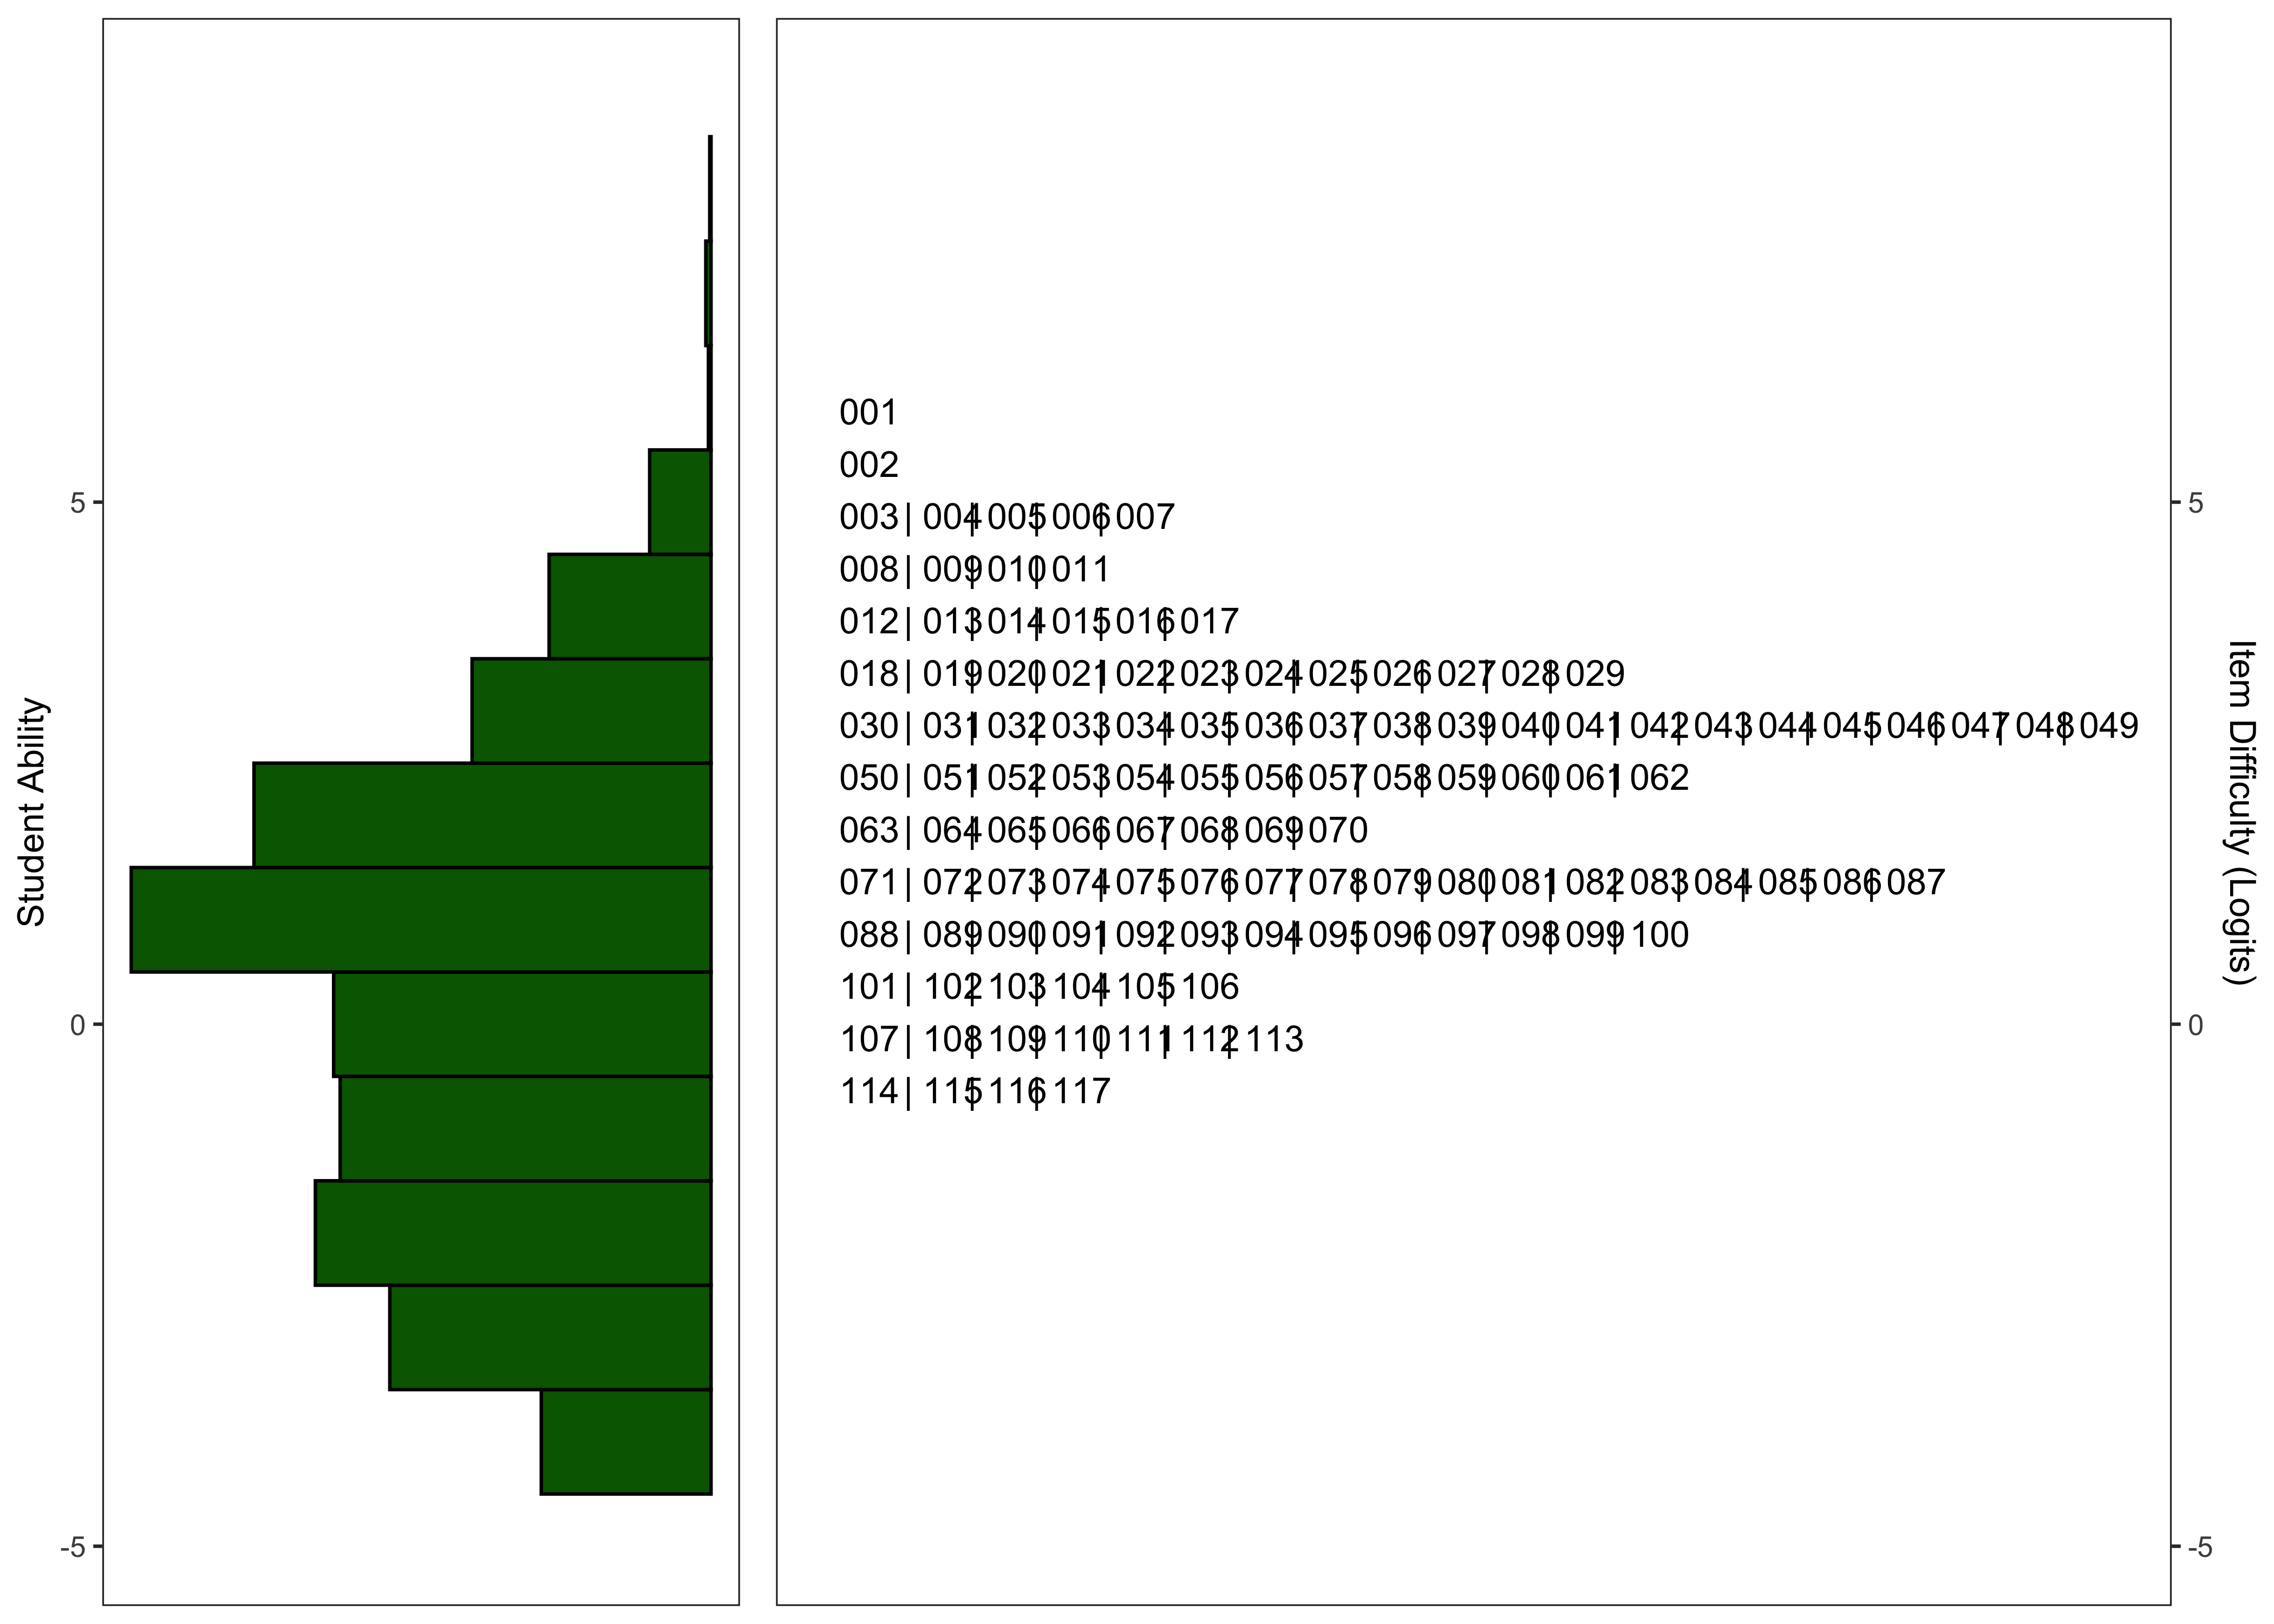
9.6.2.7 Model Summary
| Characteristic | N = 139 | N = 3,560 | N = 117 | N = 2,407 |
|---|---|---|---|---|
| Logit Scale Location | 1.46 (1.95) | 0.27 (-1.37, 1.45) | 2.16 (1.46) | 0.33 (-1.77, 1.77) |
| Outfit | 1.15 (0.64) | 0.55 (0.36, 0.85) | 0.94 (0.36) | 0.60 (0.08, 0.91) |
| Infit | 1.00 (0.13) | 0.74 (0.53, 0.98) | 0.99 (0.12) | 0.72 (0.10, 0.94) |
| Reliability of Separation | 0.8529 | 0.7923 | 0.8268 | 0.6924 |
9.6.2.7.1 Final Number of Items
Following the exclusion of items with point-biserial correlations < .20 and items with poor fit statistics, the final versions of the task contain 139 and 117 for the English and Spanish task, respectively.
9.7 Criterion Validity Evidence
9.7.1 Sample
| Characteristic |
English
|
Spanish
|
||||
|---|---|---|---|---|---|---|
| K N = 248 |
G1 N = 222 |
G2 N = 202 |
K N = 51 |
G1 N = 167 |
G2 N = 190 |
|
| Timepoint | ||||||
| Winter 2024 | 248 (100%) | 222 (100%) | 202 (100%) | 51 (100%) | 167 (100%) | 190 (100%) |
| Race | ||||||
| American/Alaskan Native | 5 (2.0%) | 3 (1.4%) | 1 (0.5%) | 0 (0%) | 4 (2.4%) | 1 (0.5%) |
| Asian | 33 (13%) | 36 (16%) | 8 (4.3%) | 2 (3.9%) | 2 (1.2%) | 0 (0%) |
| Black/African American | 26 (11%) | 27 (12%) | 34 (18%) | |||
| Not reported | 28 (11%) | 29 (13%) | 13 (7.1%) | 28 (55%) | 116 (70%) | 120 (63%) |
| Other | 72 (29%) | 44 (20%) | 3 (1.6%) | 11 (22%) | 5 (3.0%) | 10 (5.3%) |
| White | 81 (33%) | 83 (37%) | 125 (68%) | 10 (20%) | 38 (23%) | 58 (31%) |
| Unknown | 3 | 0 | 18 | 0 | 2 | 1 |
| Ethnicity | ||||||
| Hispanic/Latin(o/a) | 99 (40%) | 93 (42%) | 120 (60%) | 46 (90%) | 156 (93%) | 178 (99%) |
| Intentional nonreport | 7 (2.8%) | 2 (0.9%) | 0 (0%) | 0 (0%) | 0 (0%) | 2 (1.1%) |
| Not Hispanic/Latin(o/a) | 142 (57%) | 127 (57%) | 81 (40%) | 5 (9.8%) | 11 (6.6%) | 0 (0%) |
| Unknown | 0 | 0 | 1 | 0 | 0 | 10 |
| Gender | ||||||
| Female | 125 (50%) | 102 (46%) | 97 (48%) | 32 (63%) | 83 (50%) | 100 (53%) |
| Male | 123 (50%) | 120 (54%) | 105 (52%) | 19 (37%) | 84 (50%) | 90 (47%) |
| Home Language | ||||||
| English | 183 (75%) | 165 (75%) | 126 (82%) | 6 (12%) | 17 (10%) | 21 (11%) |
| Spanish | 30 (12%) | 24 (11%) | 23 (15%) | 44 (86%) | 147 (89%) | 168 (89%) |
| Other | 31 (13%) | 32 (14%) | 5 (3.2%) | 1 (2.0%) | 1 (0.6%) | 0 (0%) |
| Unknown | 4 | 1 | 48 | 0 | 2 | 1 |
| English Proficiency Label | ||||||
| (Re-)Classified Proficient | 10 (4.9%) | 17 (7.8%) | 11 (7.1%) | 6 (13%) | 19 (12%) | 35 (20%) |
| English Learner | 46 (23%) | 40 (18%) | 17 (11%) | 40 (83%) | 130 (79%) | 119 (68%) |
| English-only | 148 (73%) | 160 (74%) | 126 (82%) | 2 (4.2%) | 16 (9.7%) | 21 (12%) |
| Unknown | 44 | 5 | 48 | 3 | 2 | 15 |
| Ever IEP/504 | 17 (8.9%) | 21 (12%) | 17 (11%) | 1 (2.3%) | 11 (7.1%) | 6 (6.5%) |
| Unknown | 58 | 47 | 48 | 8 | 12 | 97 |
English Expressive Elision was correlated with the Elision subtest from the Comprehensive Test of Phonological Processing, 2nd Edition (CTOPP-2) test (Wagner et al. 2013). Spanish Expressive Elision was correlated with the Deletion subtest from the Test of Phonological Awareness in Spanish (TPAS)(Riccio et al. 2004).
| Grade | n | r [CI] | n | r [CI] | n | r [CI] |
|---|---|---|---|---|---|---|
| K | 248 | 0.78 [0.72, 0.82] | 46 | 0.73 [0.56, 0.84] | 51 | 0.58 [0.36, 0.74] |
| G1 | 222 | 0.71 [0.64, 0.77] | 40 | 0.66 [0.44, 0.80] | 167 | 0.47 [0.35, 0.58] |
| G2 | 202 | 0.78 [0.73, 0.83] | NA | NA | 190 | 0.51 [0.39, 0.61] |