| Characteristic |
English
|
Spanish
|
||||
|---|---|---|---|---|---|---|
| K N = 435 |
G1 N = 486 |
G2 N = 36 |
K N = 1,000 |
G1 N = 1,050 |
G2 N = 0 |
|
| Timepoint | ||||||
| Spring 2023 | 0 (0%) | 0 (0%) | 0 (0%) | 608 (61%) | 646 (62%) | 0 (NA%) |
| Winter 2024 | 303 (70%) | 338 (70%) | 0 (0%) | 0 (0%) | 0 (0%) | 0 (NA%) |
| Fall 2024 | 132 (30%) | 148 (30%) | 36 (100%) | 392 (39%) | 404 (38%) | 0 (NA%) |
| Administration Format | ||||||
| CAT | 132 (30%) | 148 (30%) | 36 (100%) | 392 (39%) | 404 (38%) | 0 (NA%) |
| Forms | 303 (70%) | 338 (70%) | 0 (0%) | 608 (61%) | 646 (62%) | 0 (NA%) |
| Race | ||||||
| American/Alaskan Native | 14 (3.3%) | 14 (2.9%) | 0 (0%) | 35 (3.6%) | 33 (3.2%) | 0 (NA%) |
| Asian | 49 (11%) | 60 (12%) | 0 (0%) | 18 (1.9%) | 18 (1.8%) | 0 (NA%) |
| Black/African American | 66 (15%) | 81 (17%) | 0 (0%) | 9 (0.9%) | 7 (0.7%) | 0 (NA%) |
| Not reported | 60 (14%) | 66 (14%) | 0 (0%) | 458 (47%) | 517 (51%) | 0 (NA%) |
| Other | 105 (24%) | 73 (15%) | 8 (100%) | 170 (18%) | 117 (12%) | 0 (NA%) |
| White | 135 (31%) | 189 (39%) | 0 (0%) | 277 (29%) | 325 (32%) | 0 (NA%) |
| Unknown | 6 | 3 | 28 | 33 | 33 | 0 |
| Ethnicity | ||||||
| Hispanic/Latin(o/a) | 194 (48%) | 233 (49%) | 0 (NA%) | 847 (97%) | 939 (97%) | 0 (NA%) |
| Intentional nonreport | 6 (1.5%) | 1 (0.2%) | 0 (NA%) | 2 (0.2%) | 2 (0.2%) | 0 (NA%) |
| Not Hispanic/Latin(o/a) | 204 (50%) | 246 (51%) | 0 (NA%) | 20 (2.3%) | 28 (2.9%) | 0 (NA%) |
| Unknown | 31 | 6 | 36 | 131 | 81 | 0 |
| Gender | ||||||
| Female | 209 (50%) | 234 (48%) | 2 (25%) | 462 (53%) | 553 (59%) | 0 (NA%) |
| Male | 212 (50%) | 249 (52%) | 6 (75%) | 407 (47%) | 388 (41%) | 0 (NA%) |
| Unknown | 14 | 3 | 28 | 131 | 109 | 0 |
| Home Language | ||||||
| English | 318 (76%) | 378 (79%) | 8 (100%) | 75 (7.8%) | 73 (7.2%) | 0 (NA%) |
| Spanish | 66 (16%) | 73 (15%) | 0 (0%) | 876 (91%) | 935 (92%) | 0 (NA%) |
| Other | 37 (8.8%) | 28 (5.8%) | 0 (0%) | 16 (1.7%) | 7 (0.7%) | 0 (NA%) |
| Unknown | 14 | 7 | 28 | 33 | 35 | 0 |
| English Proficiency Label | ||||||
| (Re-)Classified Proficient | 14 (4.0%) | 32 (7.1%) | 0 (0%) | 72 (8.7%) | 94 (10%) | 0 (NA%) |
| English Learner | 76 (22%) | 70 (16%) | 0 (0%) | 696 (84%) | 760 (83%) | 0 (NA%) |
| English-only | 259 (74%) | 348 (77%) | 8 (100%) | 57 (6.9%) | 61 (6.7%) | 0 (NA%) |
| Unknown | 86 | 36 | 28 | 175 | 135 | 0 |
| Ever IEP/504 | 24 (7.8%) | 49 (13%) | 0 (NA%) | 62 (10%) | 54 (9.9%) | 0 (NA%) |
| Unknown | 127 | 96 | 36 | 394 | 507 | 0 |
21 Semantic Mapping
21.1 Task Description
Children are shown a group of pictures and are asked to choose the picture that doesn’t belong with the others. The constructs represented by the items become more complex to increase item difficulty.
21.2 Construct
The Semantic Mapping task requires knowledge of categories and features that create a relationship between items. It requires doing a fast mapping of the objects depicted to identify within group belonging/exclusion. This task can be administered in any language given that it is a receptive task and children simply point to the picture that does not belong. The test has been calibrated in English and Spanish, but the administration instructions are available in Arabic, Madarin Tagalog, and Vietnamese.
21.3 Theoretical and Empirical Foundations
Semantic mapping provides a measure of semantic depth versus the breadth measured by the Expressive Vocabulary (EVO) task. Measures of semantic depth show slower growth in children with language disorders across school-age (McGregor et al. 2013) and can be used to distinguish bilingual children with and without language difficulties (Jasso et al. 2020). Individuals must identify underlying relationships between objects which measures not only semantic knowledge but also underlying concept development. Concept development undergirds reading comprehension and is crucial for providing the resources for reading development across languages (Kim 2023).
21.4 Item Development
A list of semantic categories was developed by the research team, using the words targeted by the curricula used in dual language programs as a reference. These categories were both ordinate (e.g., animals) and subordinate (e.g., farm animals), and had different levels of concreteness, ranging from highly concrete (e.g., fruits) to abstract (e.g., things that produce artificial light).
For each category, one foil was selected. These foils could be radically different for easier items (e.g., a rocket for a clothing category including a t-shirt and a dress) to moderately different for harder items (e.g., a spoon for a category of gardening tools including a rake and a shovel).
The number of pictures per item also varied as a proxy of difficulty, ranging from 3 pictures (2 targets and 1 foil) for easier items to 5 pictures (4 targets and 1 foil) for harder items. Researchers used iStock to choose the real pictures to represent both the target and foils. The chosen pictures underwent a rigorous selection process to meet specific criteria:
- Easily Recognizable. Emphasis was placed on selecting images that could be easily identified.
- Consistent Background. Preference was given to pictures with a clean and unobtrusive background, and a white background was opted for whenever possible. For those cases in which at least one of the pictures required a background, pictures with backgrounds were selected for all the items, to ensure visual consistency and avoid children’s use of the background as influencing their selection.
- Diversity Representation. The Justice, Equity, Diversity, and Inclusion (JEDI) team reviewed all the selected pictures to ensure diversity in representation, based on race/ethnicity, gender identity, age, cultural artifacts, etc.
- Cultural responsiveness. Items that were potentially culturally unfamiliar or inappropriate were deliberately excluded from the final selection.
21.5 Scoring
Dichotomous fixed response format of 0 points for incorrect responses or non-responses and 1 point for correct ones.
21.6 Calibration Samples
21.7 Psychometric Analysis
21.7.1 Basic Item Statistics
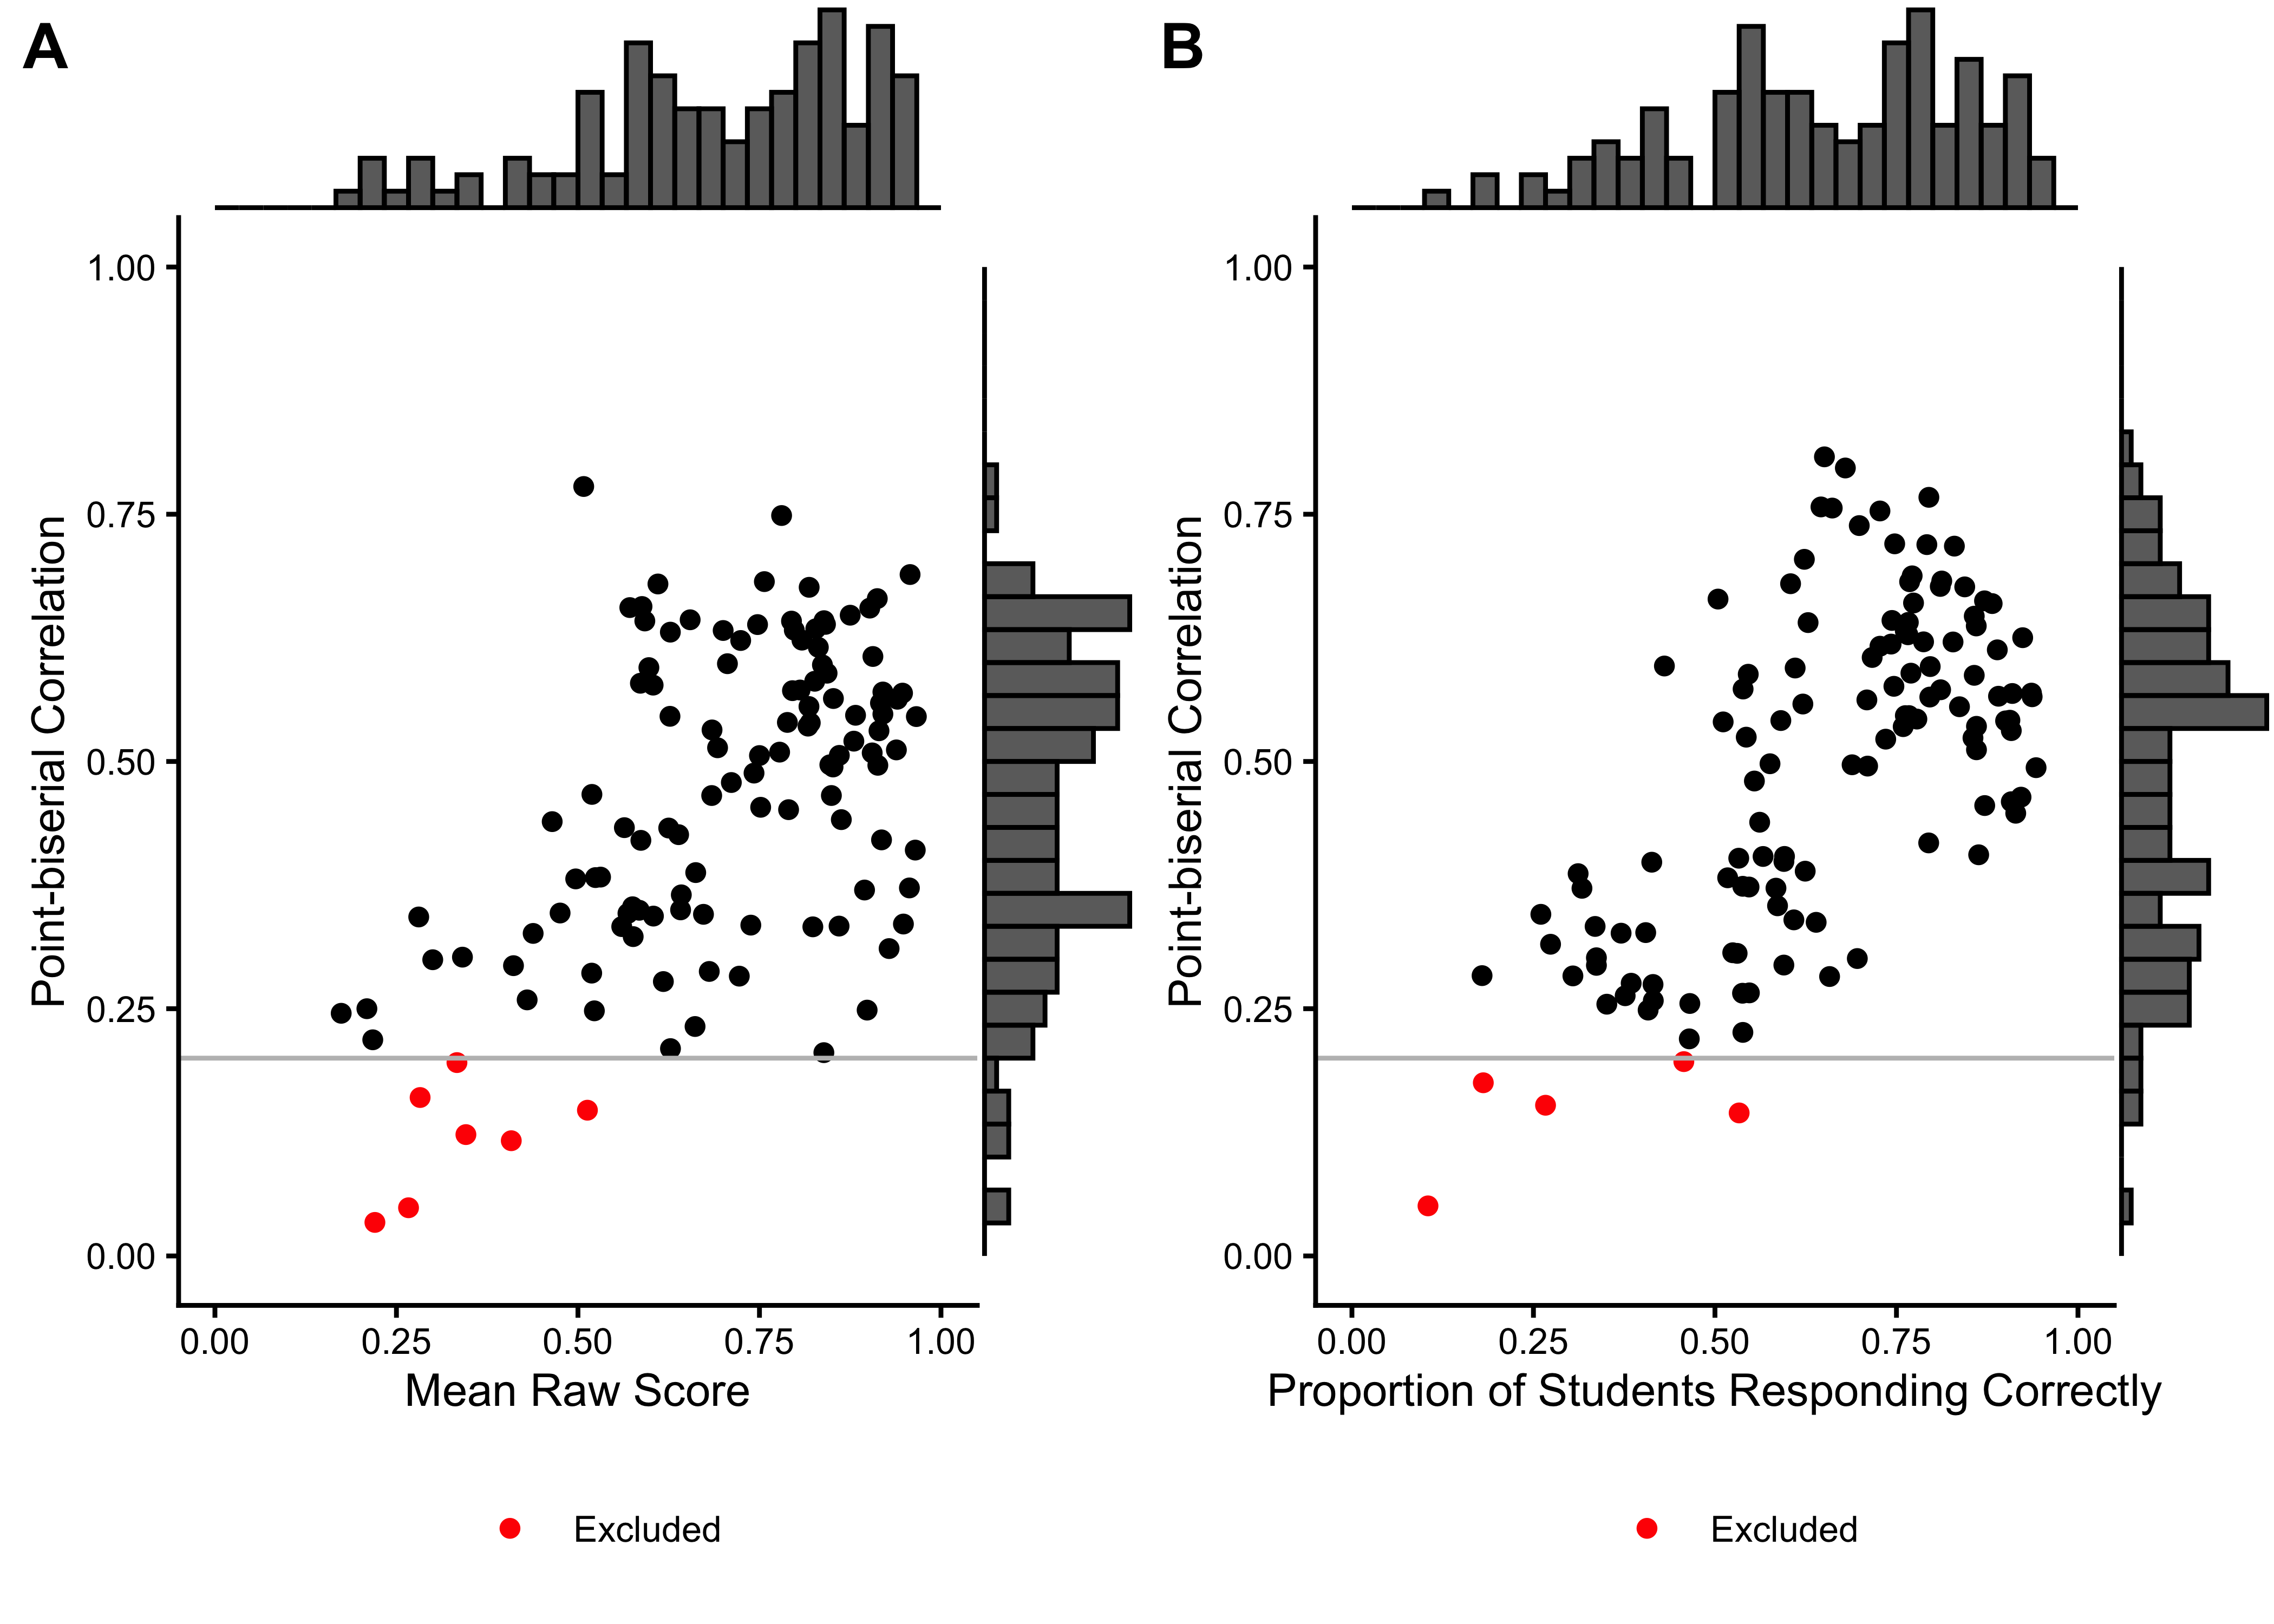
We excluded 0 items from the English task and 0 items from the Spanish task based on low response counts (n < 90). 0 items were excluded because they had no variance in the Spanish task, and 0 items in the English task. Additionally, we excluded 11 items from the English task and 6 items from the Spanish task based on low point-biserial correlations (r < 0.2). Table 21.2 summarizes the basic item characteristics, Figure 21.1 shows the relationship between point-biserial correlations and the proportion of correct responses for each item.
English
|
Spanish
|
|||
|---|---|---|---|---|
| Characteristic |
Before Excl.
|
After Excl.
|
Before Excl.
|
After Excl.
|
| N = 124 | N = 113 | N = 124 | N = 118 | |
| No. of Responses | 124 (91) | 130 (93) | 249 (162) | 256 (163) |
| Proportion Correct | 0.67 (0.22) | 0.71 (0.18) | 0.64 (0.20) | 0.66 (0.19) |
| Point-biserial Correlation | 0.44 (0.18) | 0.48 (0.14) | 0.48 (0.17) | 0.50 (0.15) |
| Excluded (n < 90) | 0 (0%) | 0 (0%) | 0 (0%) | 0 (0%) |
| Excluded (pbis < .2) | 11 (8.9%) | 0 (0%) | 6 (4.8%) | 0 (0%) |
| Excluded (no variation) | 0 (0%) | 0 (0%) | 0 (0%) | 0 (0%) |
21.7.2 Rasch Analysis
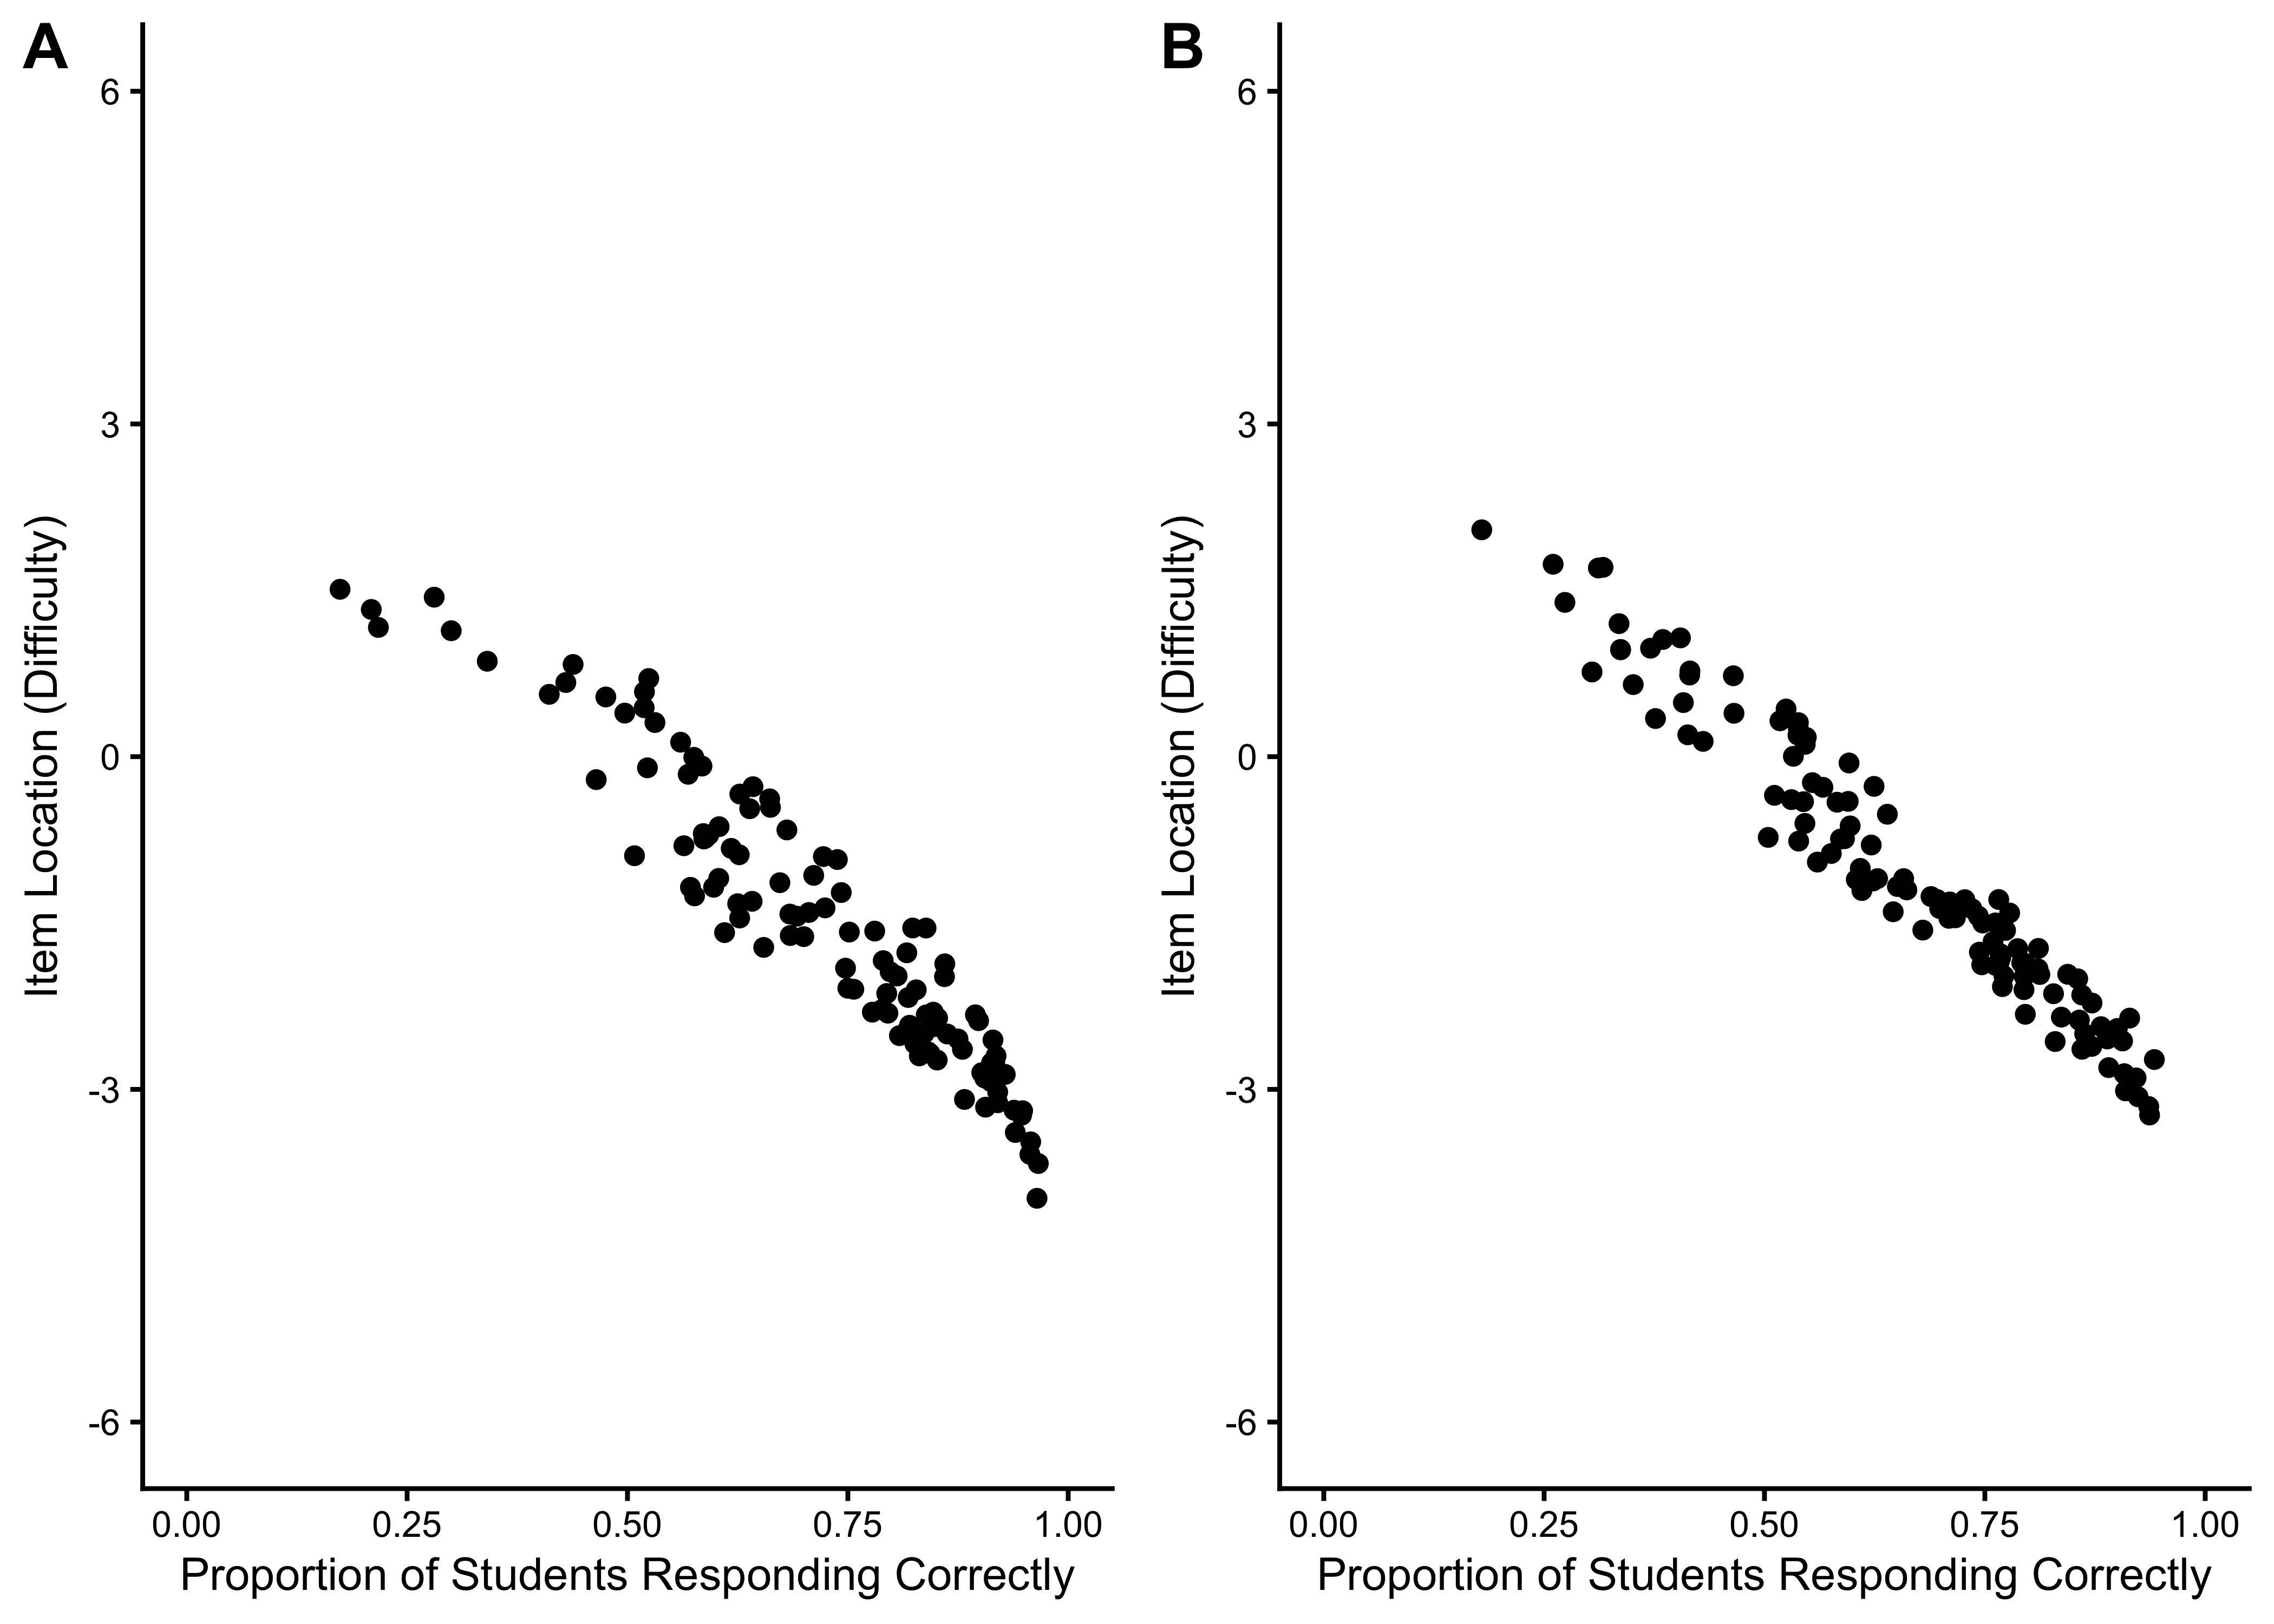
21.7.2.1 Item Location Estimates
21.7.2.2 Item Fit Statistics
| A | B | C | D | Total | A | B | C | D | Total | |
|---|---|---|---|---|---|---|---|---|---|---|
| Outfit MSE | ||||||||||
| A | 91 | 0 | 0 | 0 | 91 | 103 | 0 | 0 | 0 | 103 |
| B | 13 | 0 | 0 | 0 | 13 | 7 | 0 | 0 | 0 | 7 |
| C | 9 | 0 | 0 | 0 | 9 | 8 | 0 | 0 | 0 | 8 |
| D | 0 | 0 | 0 | 0 | 0 | 0 | 0 | 0 | 0 | 0 |
| Total | 113 | 0 | 0 | 0 | 113 | 118 | 0 | 0 | 0 | 118 |
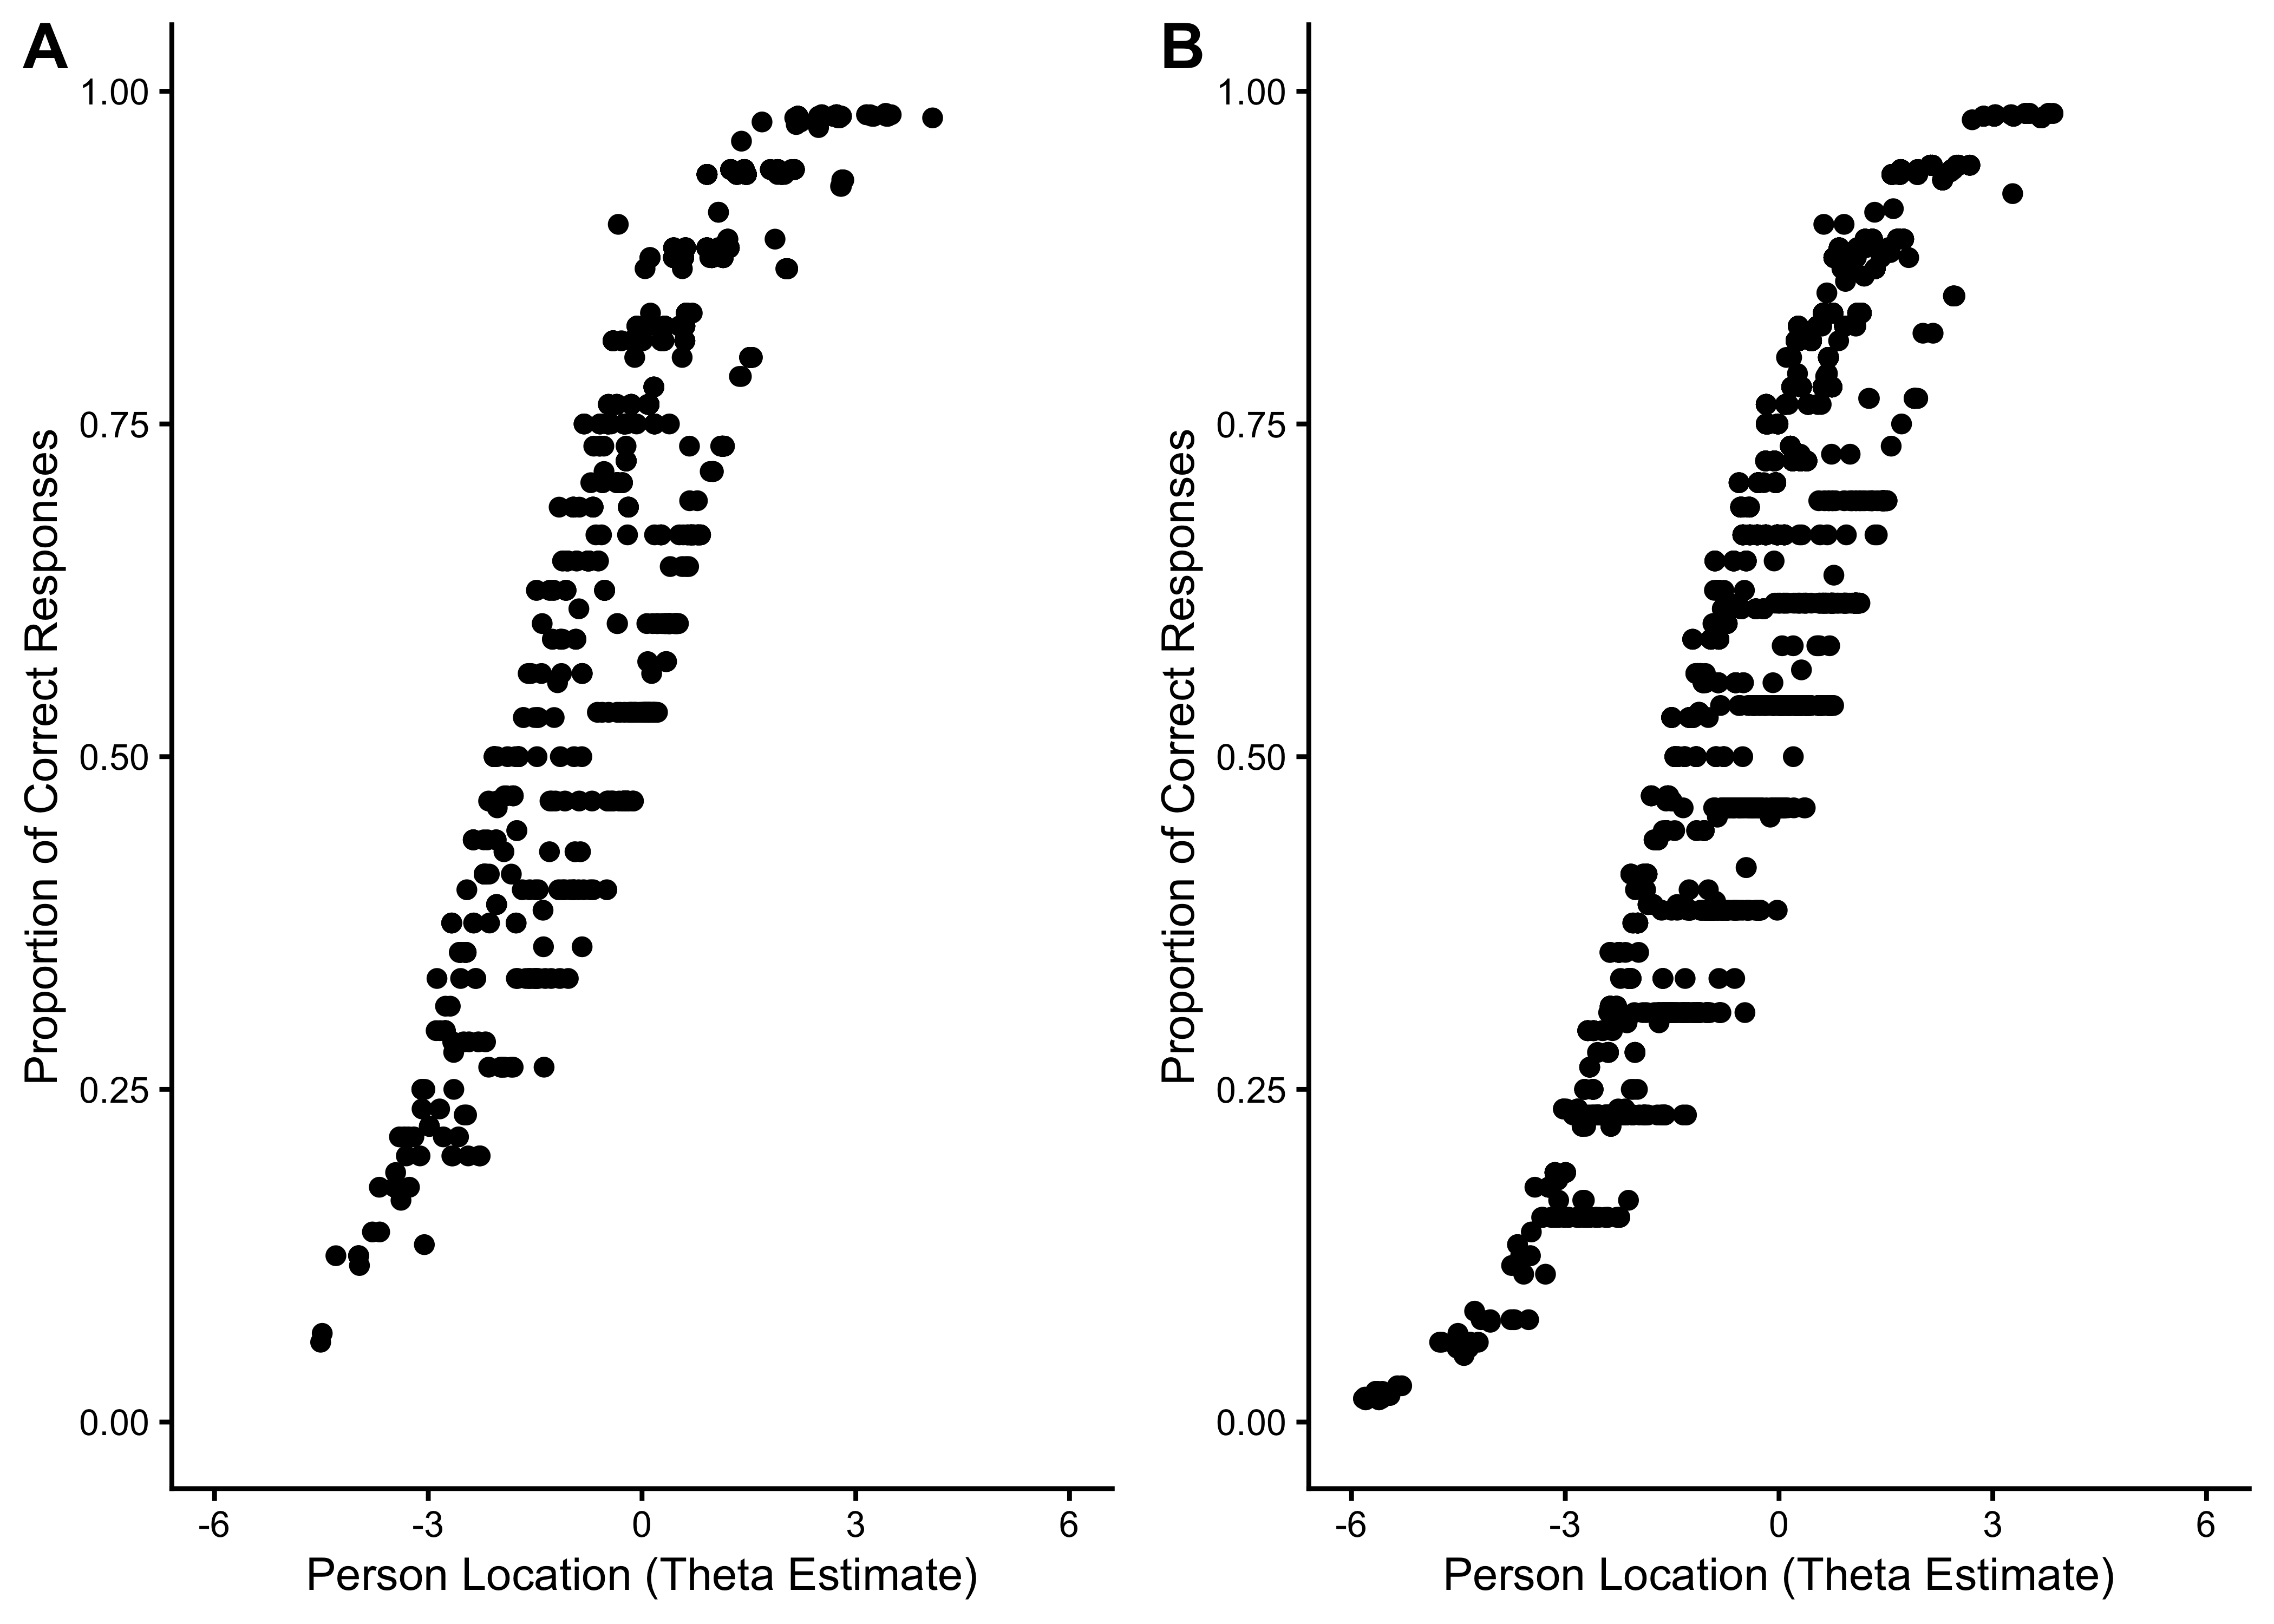
21.7.2.3 Person Location Estimates
21.7.2.4 Person Fit Statistics
| A | B | C | D | Total | A | B | C | D | Total | |
|---|---|---|---|---|---|---|---|---|---|---|
| Outfit MSE | ||||||||||
| A | 640 | 0 | 0 | 0 | 640 | 1,396 | 0 | 4 | 0 | 1,400 |
| B | 156 | 89 | 0 | 0 | 245 | 269 | 155 | 0 | 0 | 424 |
| C | 23 | 0 | 5 | 0 | 28 | 86 | 0 | 13 | 0 | 99 |
| D | 8 | 0 | 8 | 4 | 20 | 20 | 0 | 10 | 2 | 32 |
| Total | 827 | 89 | 13 | 4 | 933 | 1,771 | 155 | 27 | 2 | 1,955 |
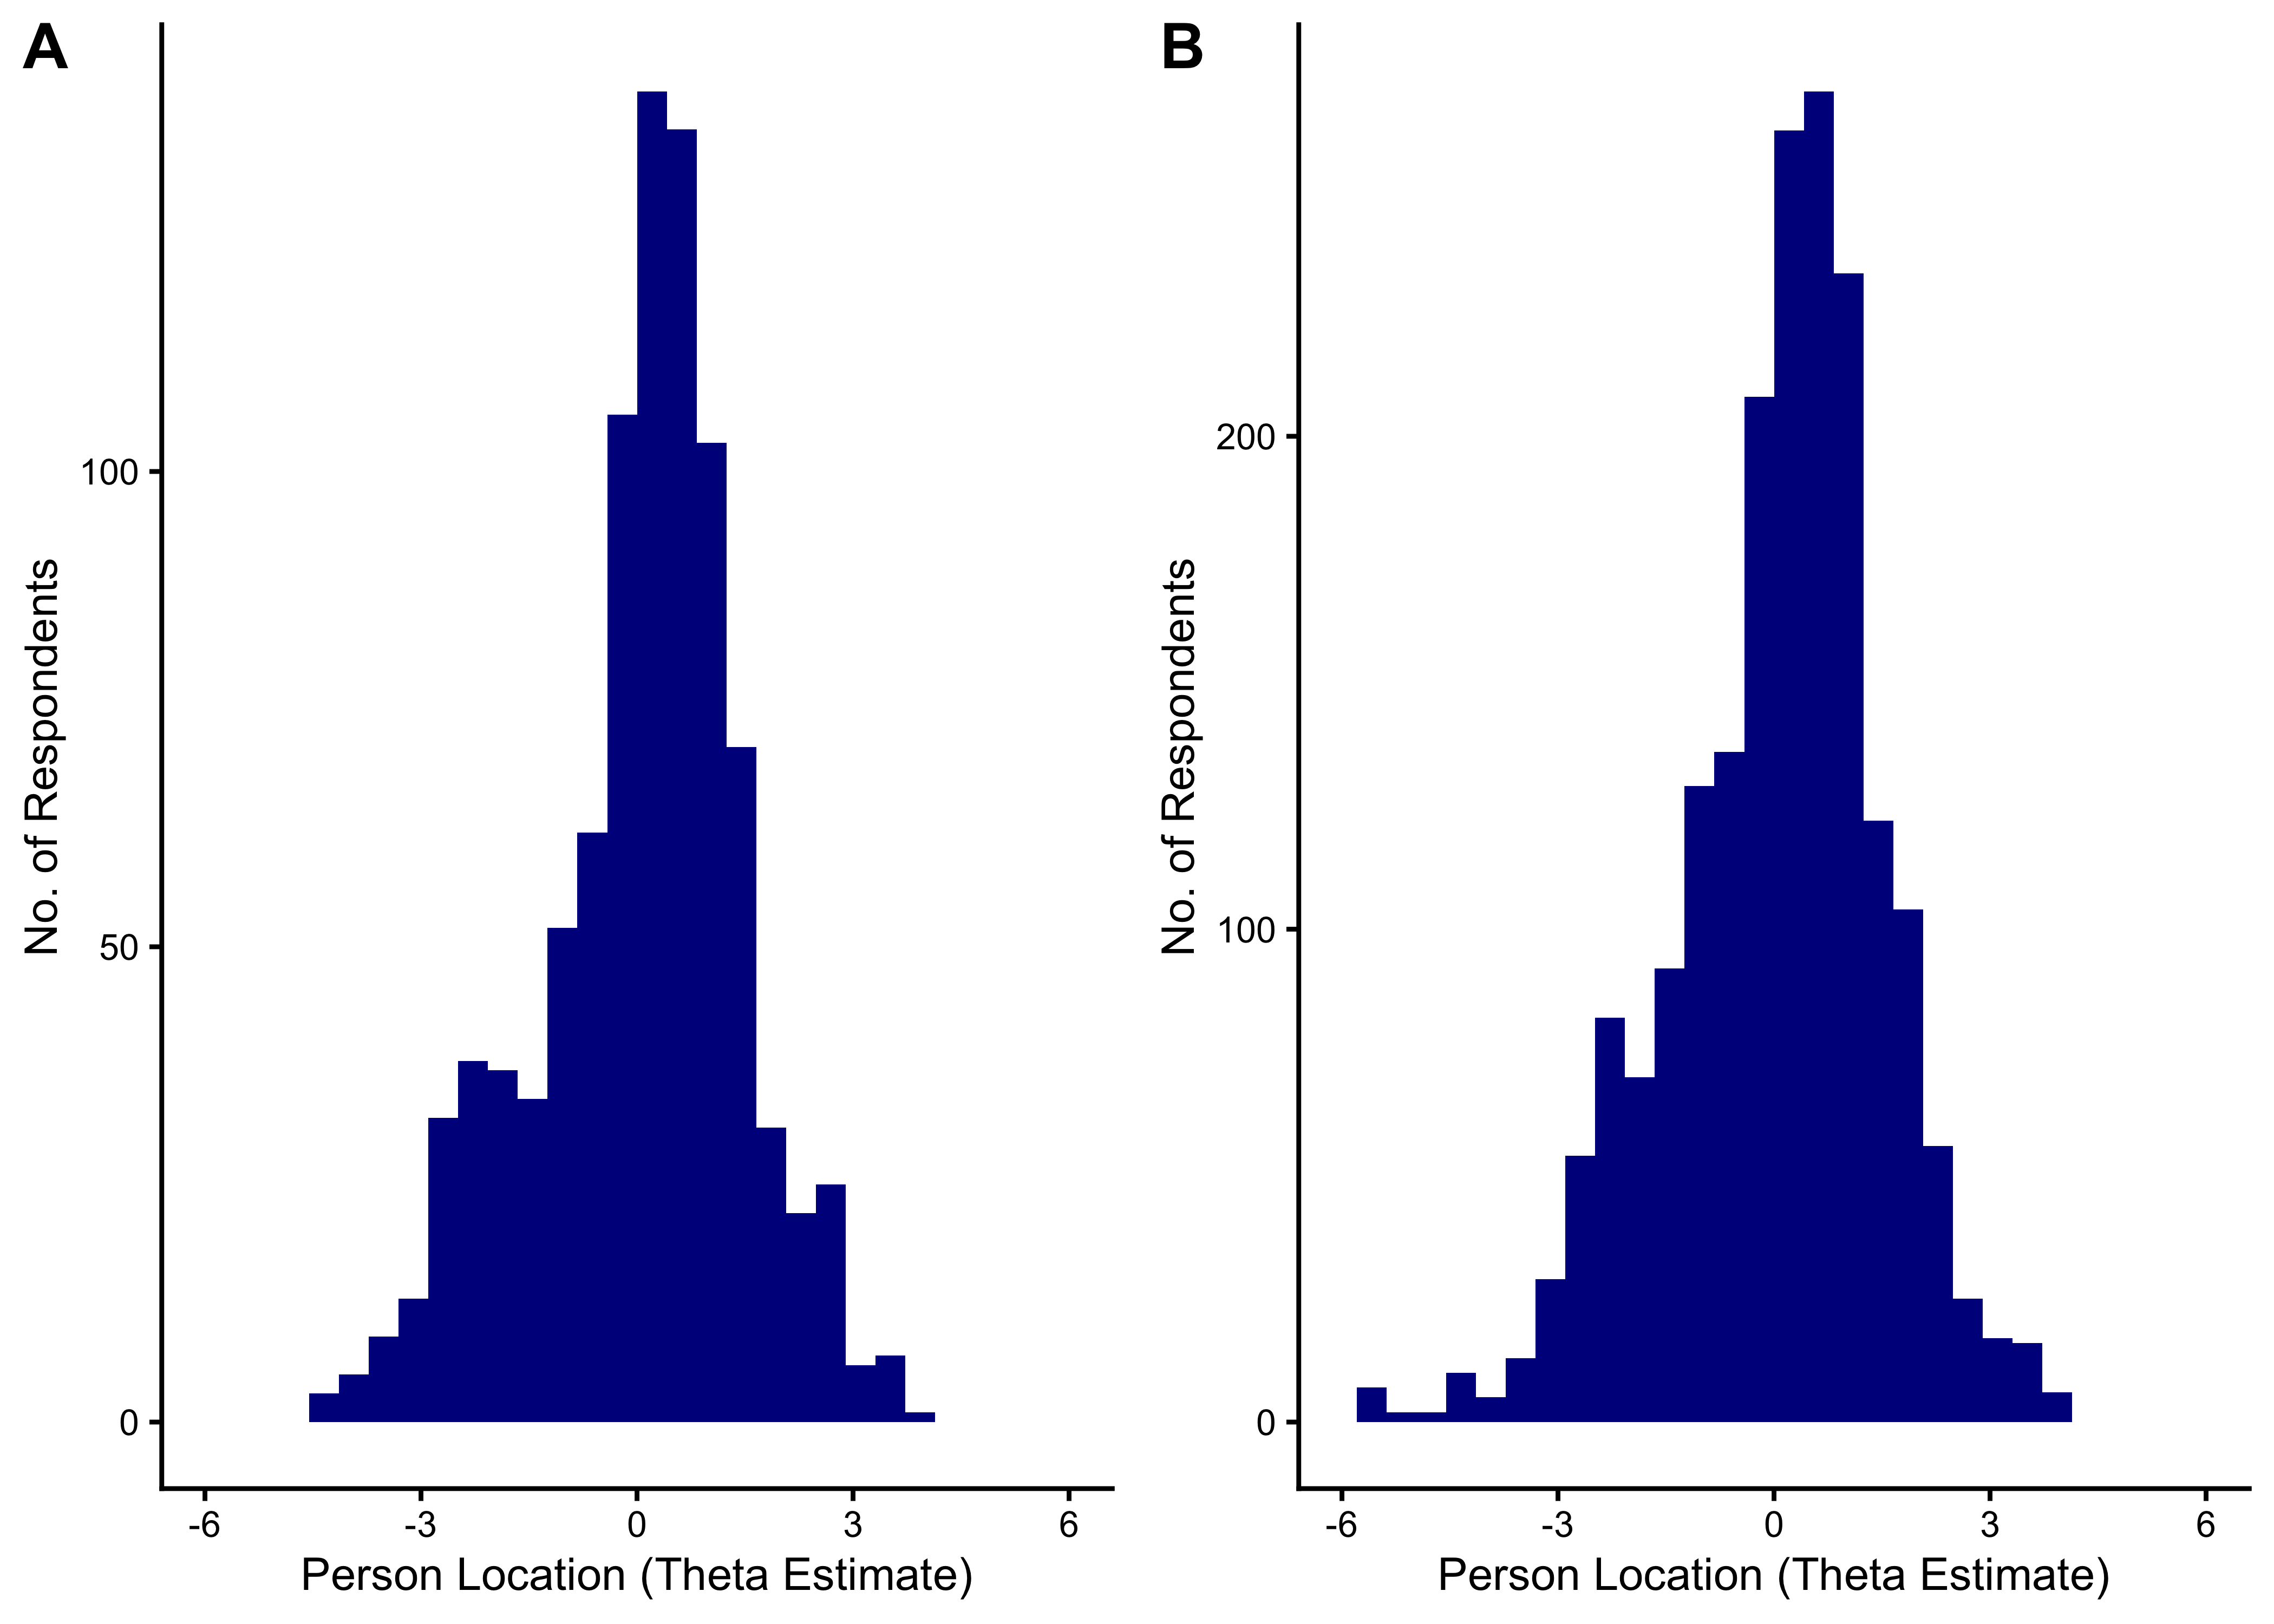
21.7.2.5 Distribution of Theta Estimates
21.7.2.6 Wright Maps
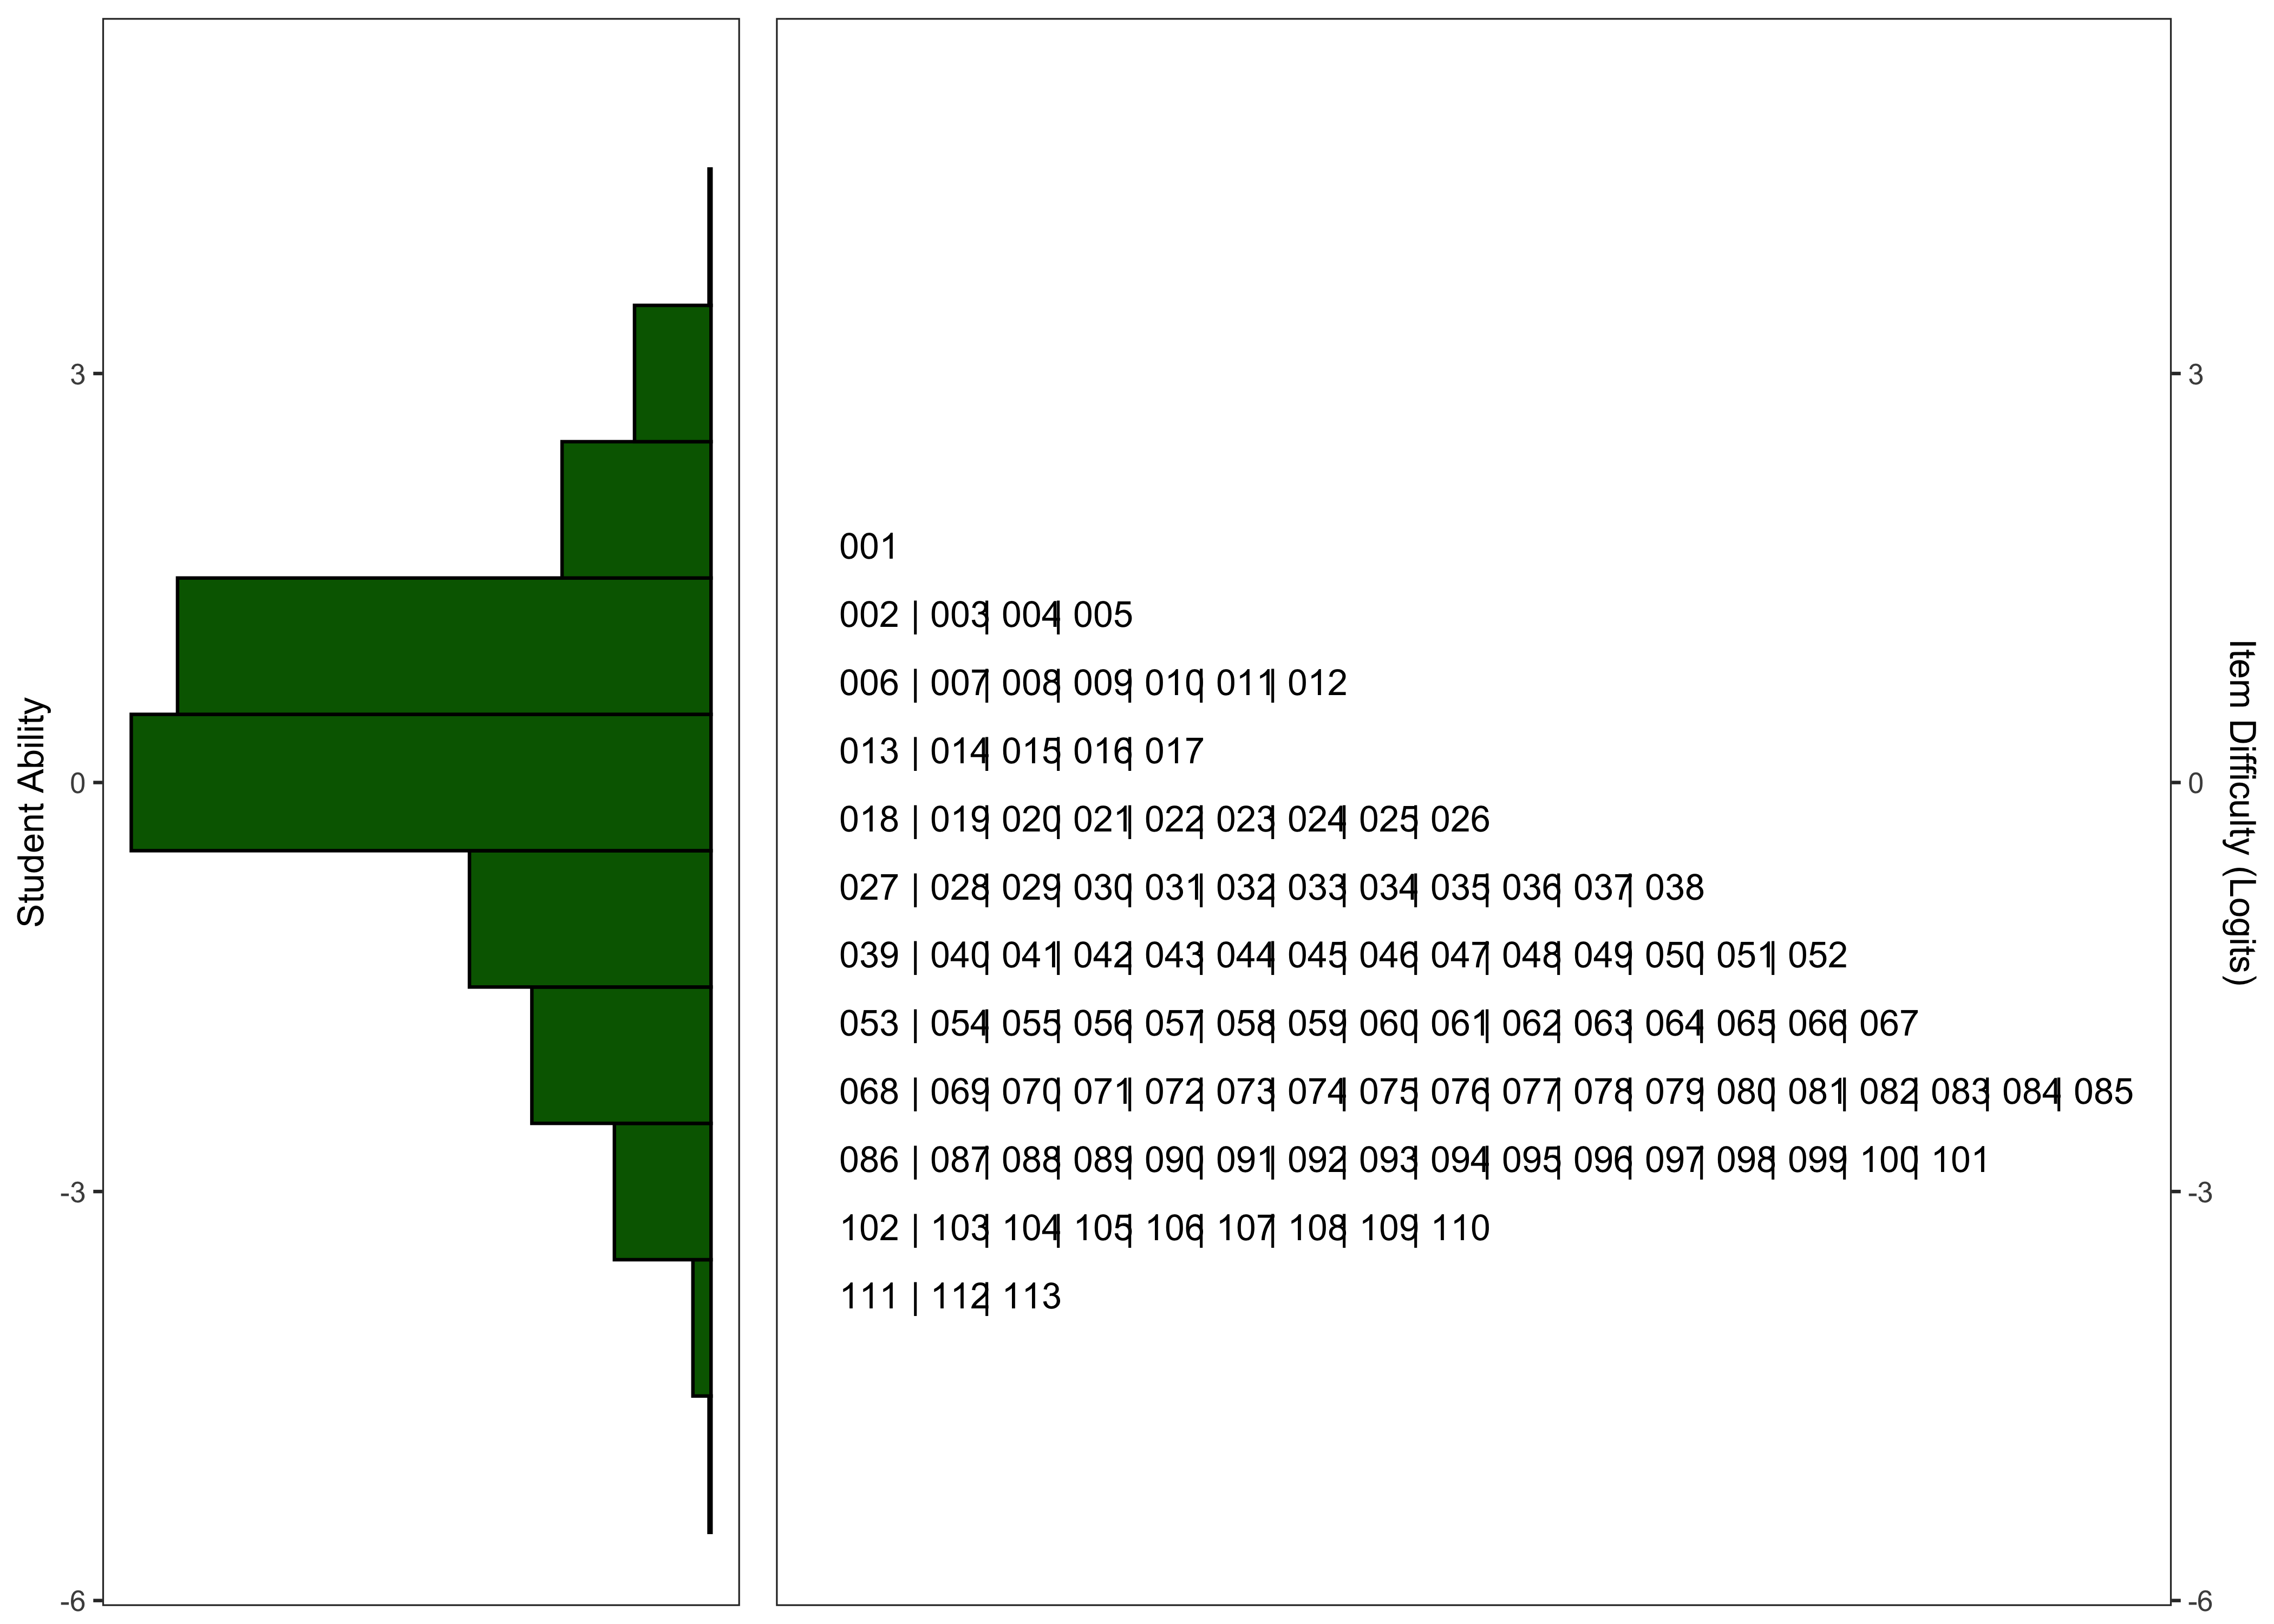
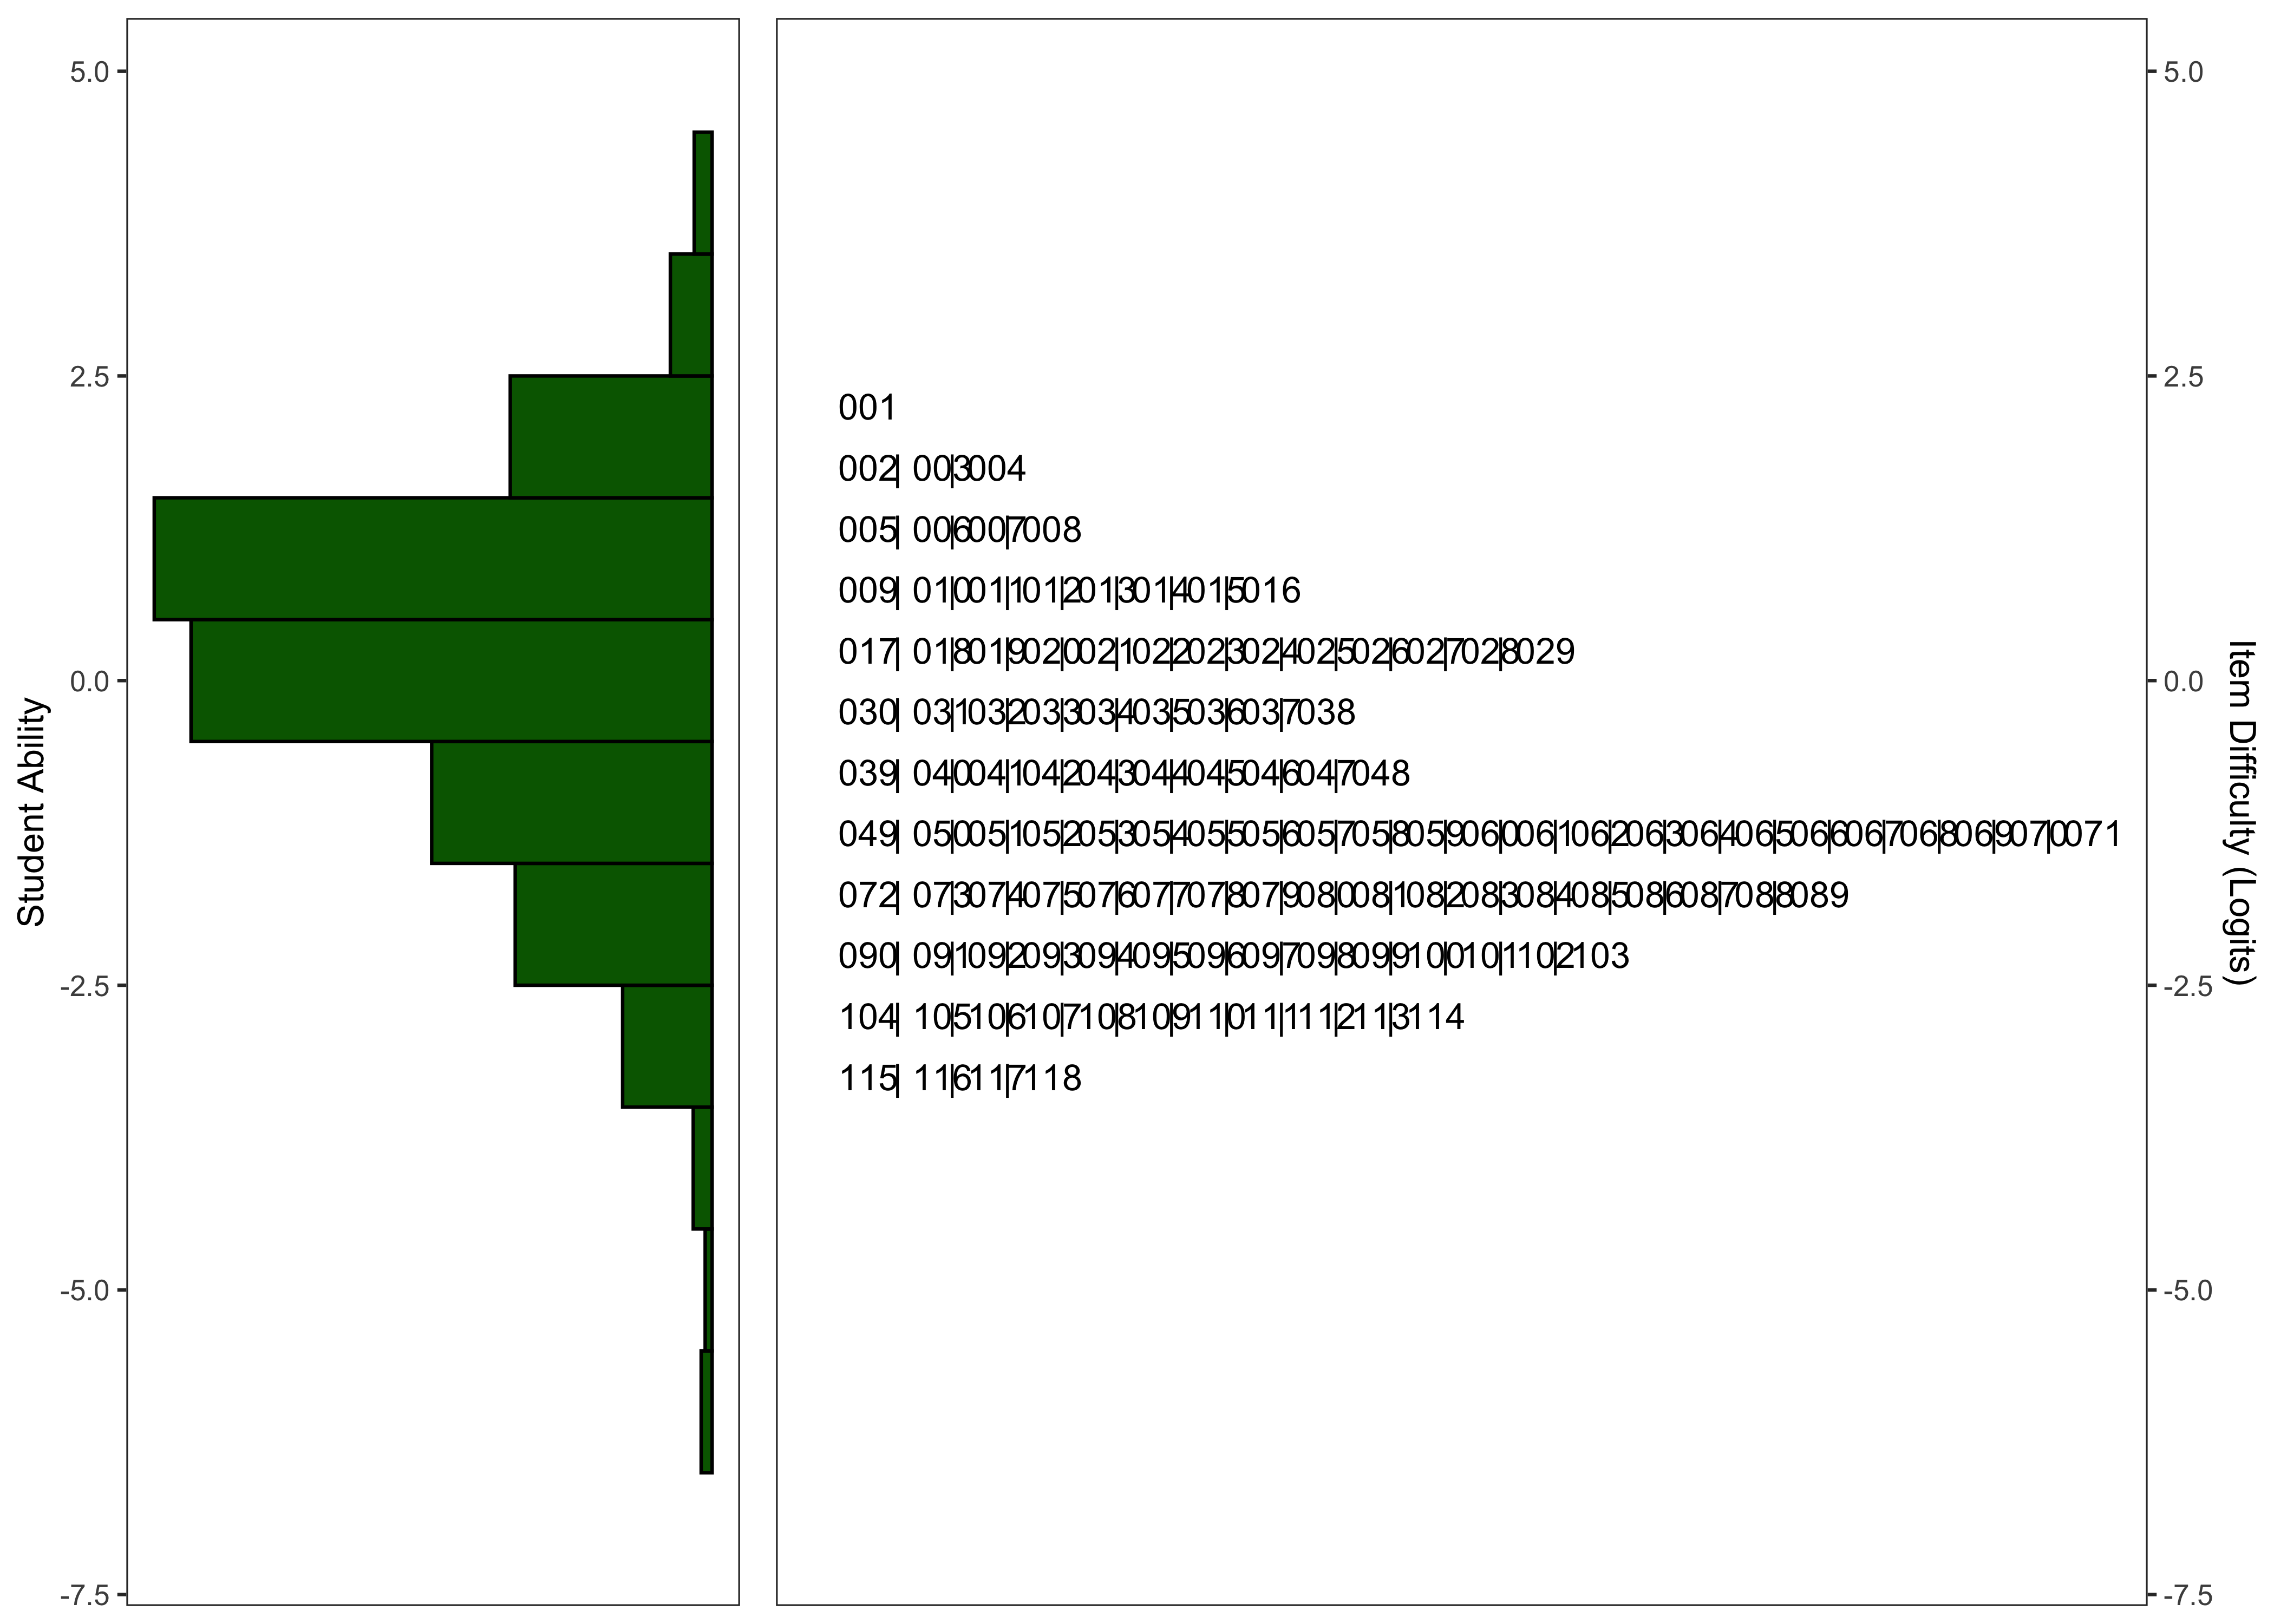
21.7.2.7 Model Summary
| Characteristic | N = 113 | N = 933 | N = 118 | N = 1,955 |
|---|---|---|---|---|
| Logit Scale Location | -1.49 (1.30) | 0.16 (-0.74, 0.98) | -1.06 (1.28) | 0.27 (-0.84, 1.05) |
| Outfit | 0.93 (0.36) | 0.79 (0.49, 1.00) | 0.95 (0.32) | 0.83 (0.54, 1.04) |
| Infit | 0.97 (0.14) | 0.88 (0.73, 1.04) | 0.97 (0.15) | 0.89 (0.75, 1.05) |
| Reliability of Separation | 0.7647 | 0.6828 | 0.7908 | 0.7474 |
21.7.2.7.1 Final Number of Items
Following the exclusion of items with point-biserial correlations < .20 and items with poor fit statistics, the final versions of the task contain 113 and 118 for the English and Spanish task, respectively.
21.8 Criterion Validity Evidence
21.8.1 Sample
Forthcoming.
#| label: tbl-criterion-validity-smt #| tbl-cap: “Concurrent Criterion Validity Correlations for the English and Spanish Semantic Mapping Tasks” tbl.critval <- fun.criterion_validity_table(“SMT”) tbl.critval ``