| Characteristic |
English
|
Spanish
|
||
|---|---|---|---|---|
| K N = 2,306 |
G1 N = 668 |
K N = 1,140 |
G1 N = 650 |
|
| Timepoint | ||||
| Spring 2023 | 0 (0%) | 0 (0%) | 606 (53%) | 644 (99%) |
| Fall 2023 | 605 (26%) | 660 (99%) | 0 (0%) | 0 (0%) |
| Fall 2024 | 1,701 (74%) | 8 (1.2%) | 534 (47%) | 6 (0.9%) |
| Administration Format | ||||
| CAT | 1,701 (74%) | 8 (1.2%) | 534 (47%) | 6 (0.9%) |
| Forms | 605 (26%) | 660 (99%) | 606 (53%) | 644 (99%) |
| Race | ||||
| American/Alaskan Native | 88 (4.1%) | 12 (1.8%) | 38 (3.4%) | 8 (1.3%) |
| Asian | 154 (7.1%) | 86 (13%) | 21 (1.9%) | 7 (1.1%) |
| Black/African American | 203 (9.4%) | 78 (12%) | 11 (1.0%) | 4 (0.6%) |
| Not reported | 259 (12%) | 127 (19%) | 462 (42%) | 385 (62%) |
| Other | 521 (24%) | 76 (11%) | 226 (20%) | 52 (8.4%) |
| White | 944 (44%) | 288 (43%) | 347 (31%) | 164 (26%) |
| Unknown | 137 | 1 | 35 | 30 |
| Ethnicity | ||||
| Hispanic/Latin(o/a) | 1,388 (70%) | 347 (52%) | 954 (97%) | 559 (96%) |
| Intentional nonreport | 19 (1.0%) | 3 (0.4%) | 3 (0.3%) | 1 (0.2%) |
| Not Hispanic/Latin(o/a) | 563 (29%) | 317 (48%) | 23 (2.3%) | 20 (3.4%) |
| Unknown | 336 | 1 | 160 | 70 |
| Gender | ||||
| Female | 997 (50%) | 315 (47%) | 520 (53%) | 346 (60%) |
| Male | 997 (50%) | 352 (53%) | 459 (47%) | 234 (40%) |
| Unknown | 312 | 1 | 161 | 70 |
| Home Language | ||||
| English | 1,277 (63%) | 490 (74%) | 113 (10%) | 72 (12%) |
| Spanish | 671 (33%) | 105 (16%) | 975 (88%) | 539 (87%) |
| Other | 82 (4.0%) | 70 (11%) | 16 (1.4%) | 7 (1.1%) |
| Unknown | 276 | 3 | 36 | 32 |
| English Proficiency Label | ||||
| (Re-)Classified Proficient | 76 (4.1%) | 62 (9.5%) | 72 (7.6%) | 49 (8.8%) |
| English Learner | 606 (33%) | 123 (19%) | 789 (84%) | 451 (81%) |
| English-only | 1,161 (63%) | 471 (72%) | 83 (8.8%) | 59 (11%) |
| Unknown | 463 | 12 | 196 | 91 |
| Ever IEP/504 | 123 (7.8%) | 64 (11%) | 71 (10.0%) | 25 (13%) |
| Unknown | 725 | 106 | 427 | 452 |
10 Elision-Receptive
10.1 Task Description
Children are shown three pictures, each of which is named for them. They then hear a word and are prompted to take away part of it. Children are asked to select the picture that represents the resulting word.
10.2 Construct
The Elision-Receptive task measures phonological awareness and auditory manipulation skills. Students hear a word and are asked to delete a specific linguistic unit (compound word, syllable, or phoneme), then select a picture representing the portion of the word that remains. This task emphasizes auditory discrimination, phonological processing, and receptive language abilities, providing insight into students’ ability to manipulate language units without requiring verbal production.
10.3 Item Development
An original list of words was developed from English and Dual Language Program curricula commonly used in California. Researchers later extended the list to increase the item pool for the Elision-Receptive task.
Words were chosen such that, when a specified linguistic unit (word, syllable, or phoneme) was removed, the remainder formed a new, valid word that was also imageable. The removable element could appear at the beginning, the end, or in the middle of the word.
To ensure a diverse range of sounds, items were screened to minimize repetition of syllables and phonemes (e.g., blends with /ɹ/ or /l/).
The Elision Receptive target words were selected for easy imaginability and concreteness, with pictures designed to be universally recognizable to reduce cultural bias.
10.4 Scoring
Dichotomous fixed response format of 0 points for incorrect responses or non-responses and 1 point for correct ones.
10.5 Calibration Samples
10.6 Psychometric Analysis
10.6.1 Basic Item Statistics
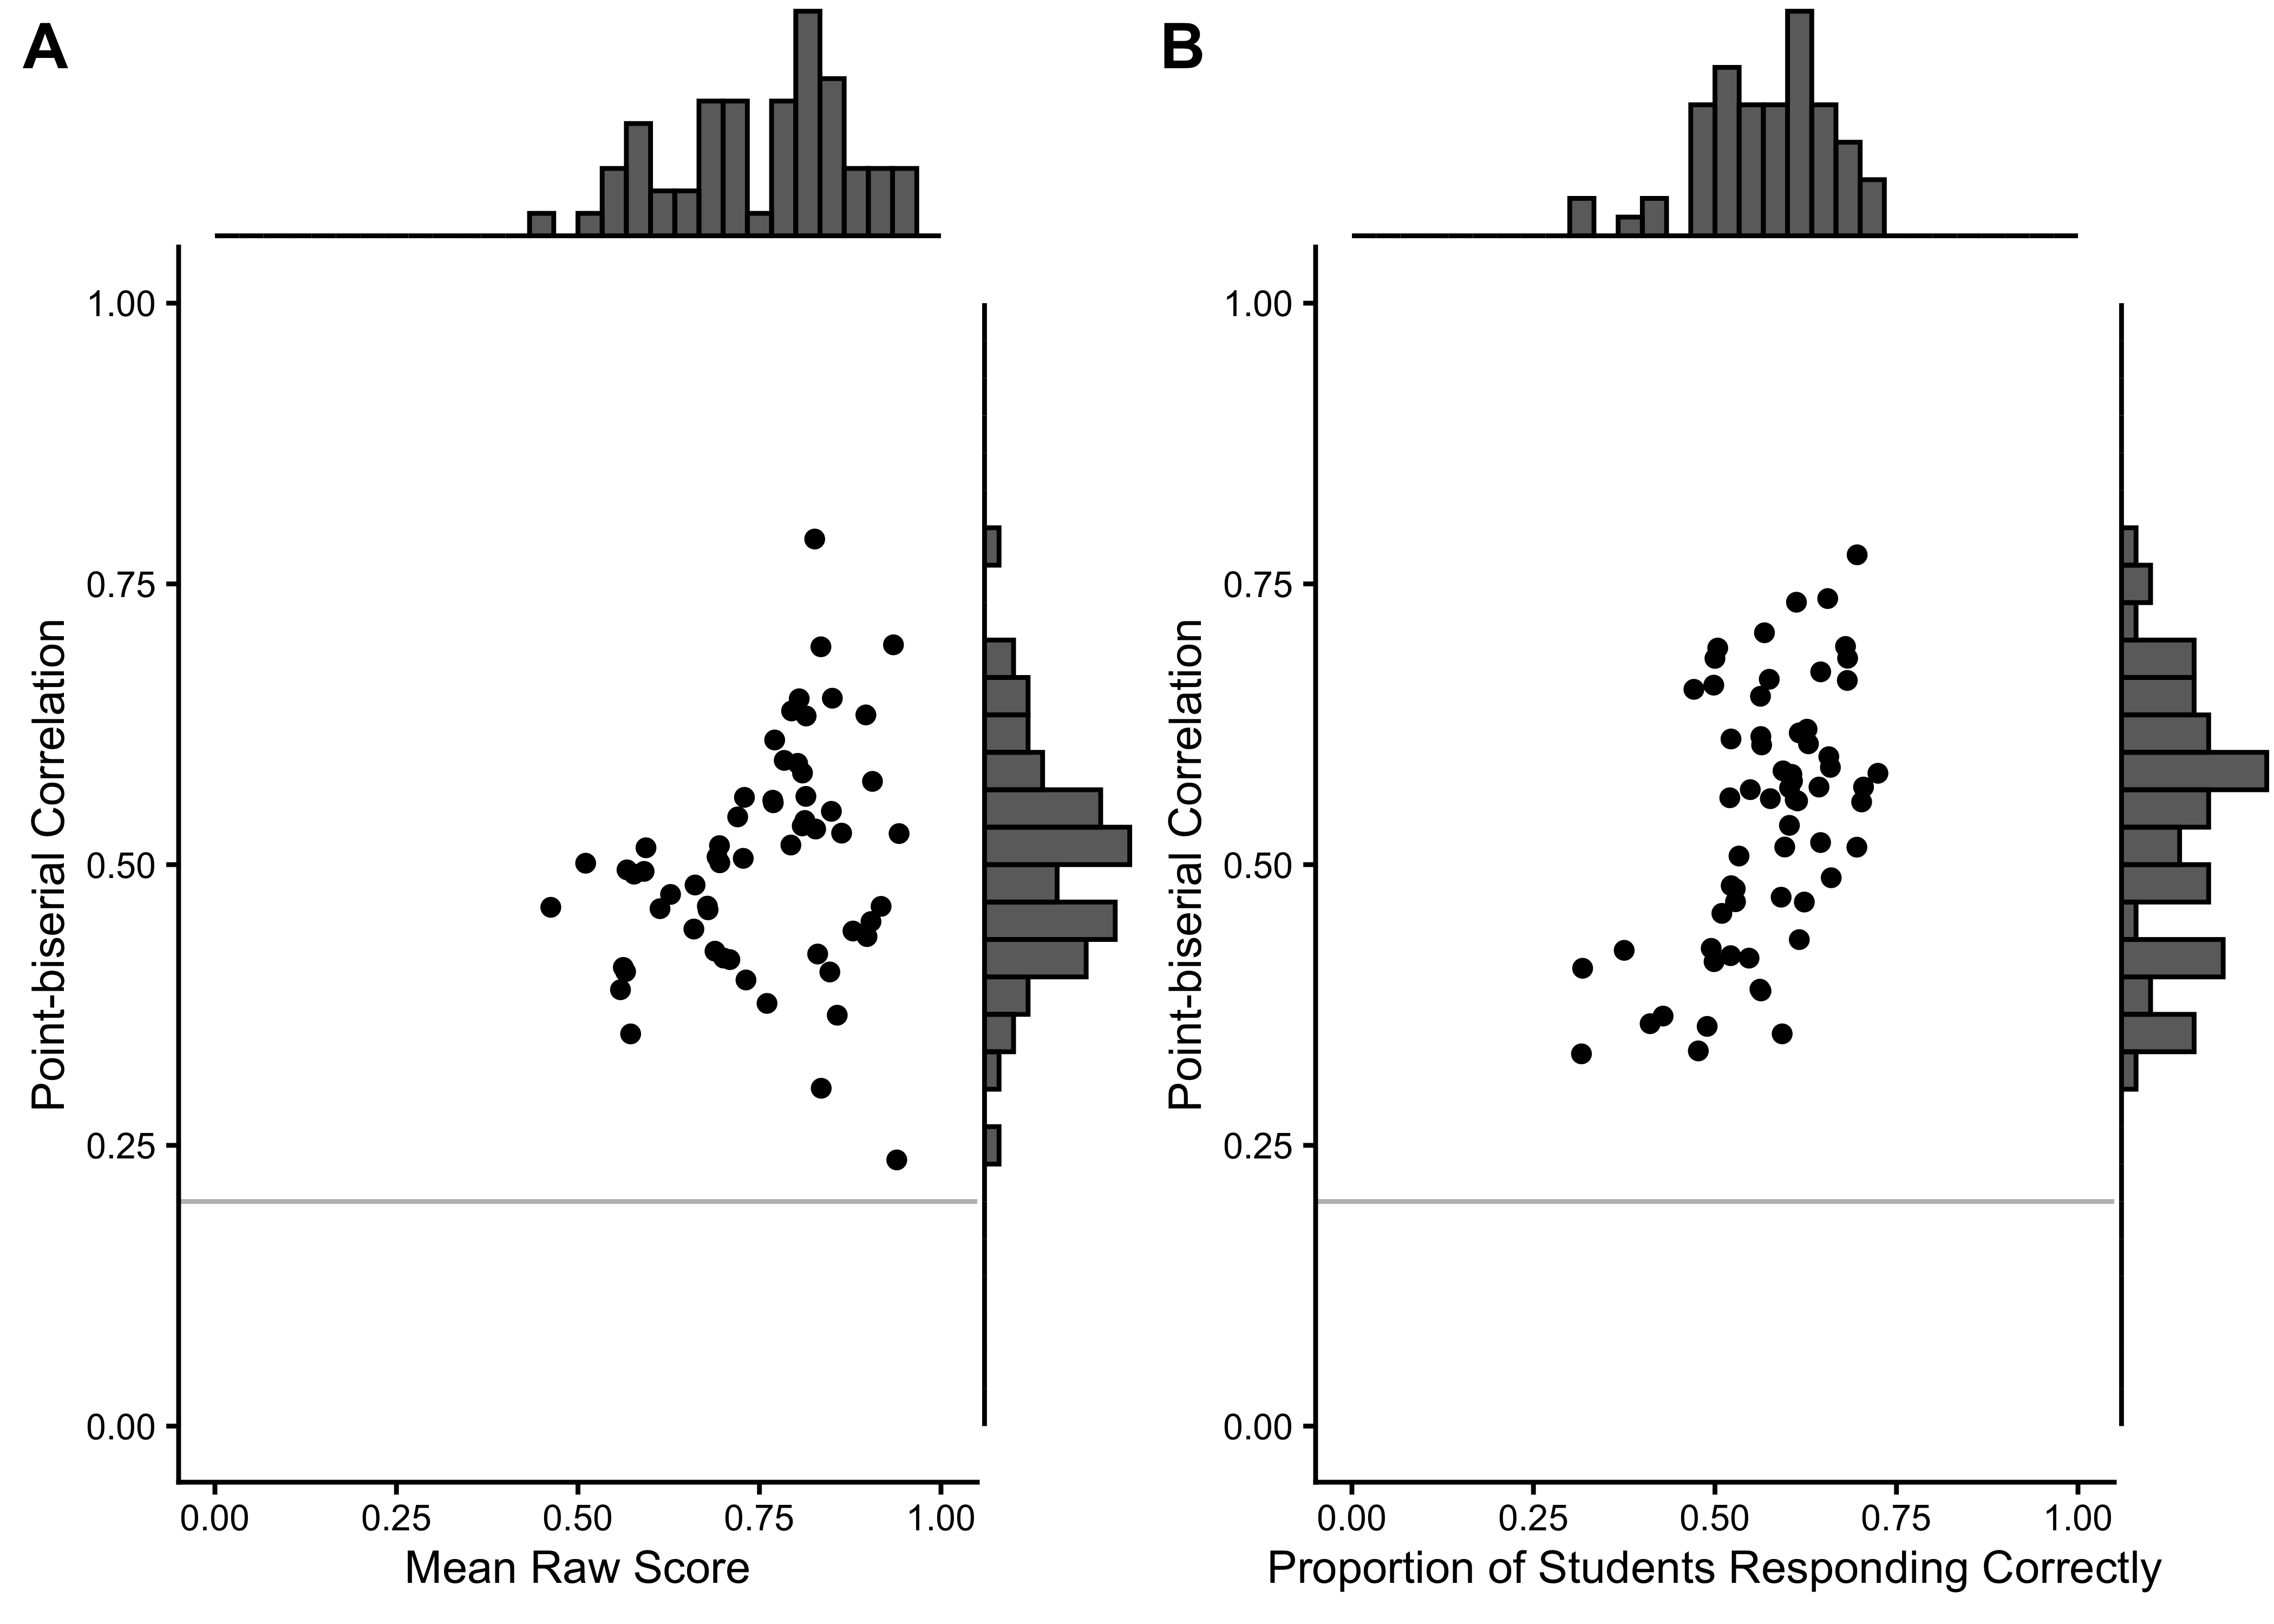
We excluded 0 items from the English task and 0 items from the Spanish task based on low response counts (n < 90). 0 items were excluded because they had no variance in the Spanish task, and 0 items in the English task. Additionally, we excluded 0 items from the English task and 0 items from the Spanish task based on low point-biserial correlations (r < 0.2). Table 10.2 summarizes the basic item characteristics, Figure 10.1 shows the relationship between point-biserial correlations and the proportion of correct responses for each item.
English
|
Spanish
|
|||
|---|---|---|---|---|
| Characteristic |
Before Excl.
|
After Excl.
|
Before Excl.
|
After Excl.
|
| N = 59 | N = 59 | N = 62 | N = 62 | |
| No. of Responses | 636 (768) | 636 (768) | 274 (158) | 274 (158) |
| Proportion Correct | 0.75 (0.12) | 0.75 (0.12) | 0.57 (0.09) | 0.57 (0.09) |
| Point-biserial Correlation | 0.50 (0.10) | 0.50 (0.10) | 0.54 (0.11) | 0.54 (0.11) |
| Excluded (n < 90) | 0 (0%) | 0 (0%) | 0 (0%) | 0 (0%) |
| Excluded (pbis < .2) | 0 (0%) | 0 (0%) | 0 (0%) | 0 (0%) |
| Excluded (no variation) | 0 (0%) | 0 (0%) | 0 (0%) | 0 (0%) |
10.6.2 Rasch Analysis
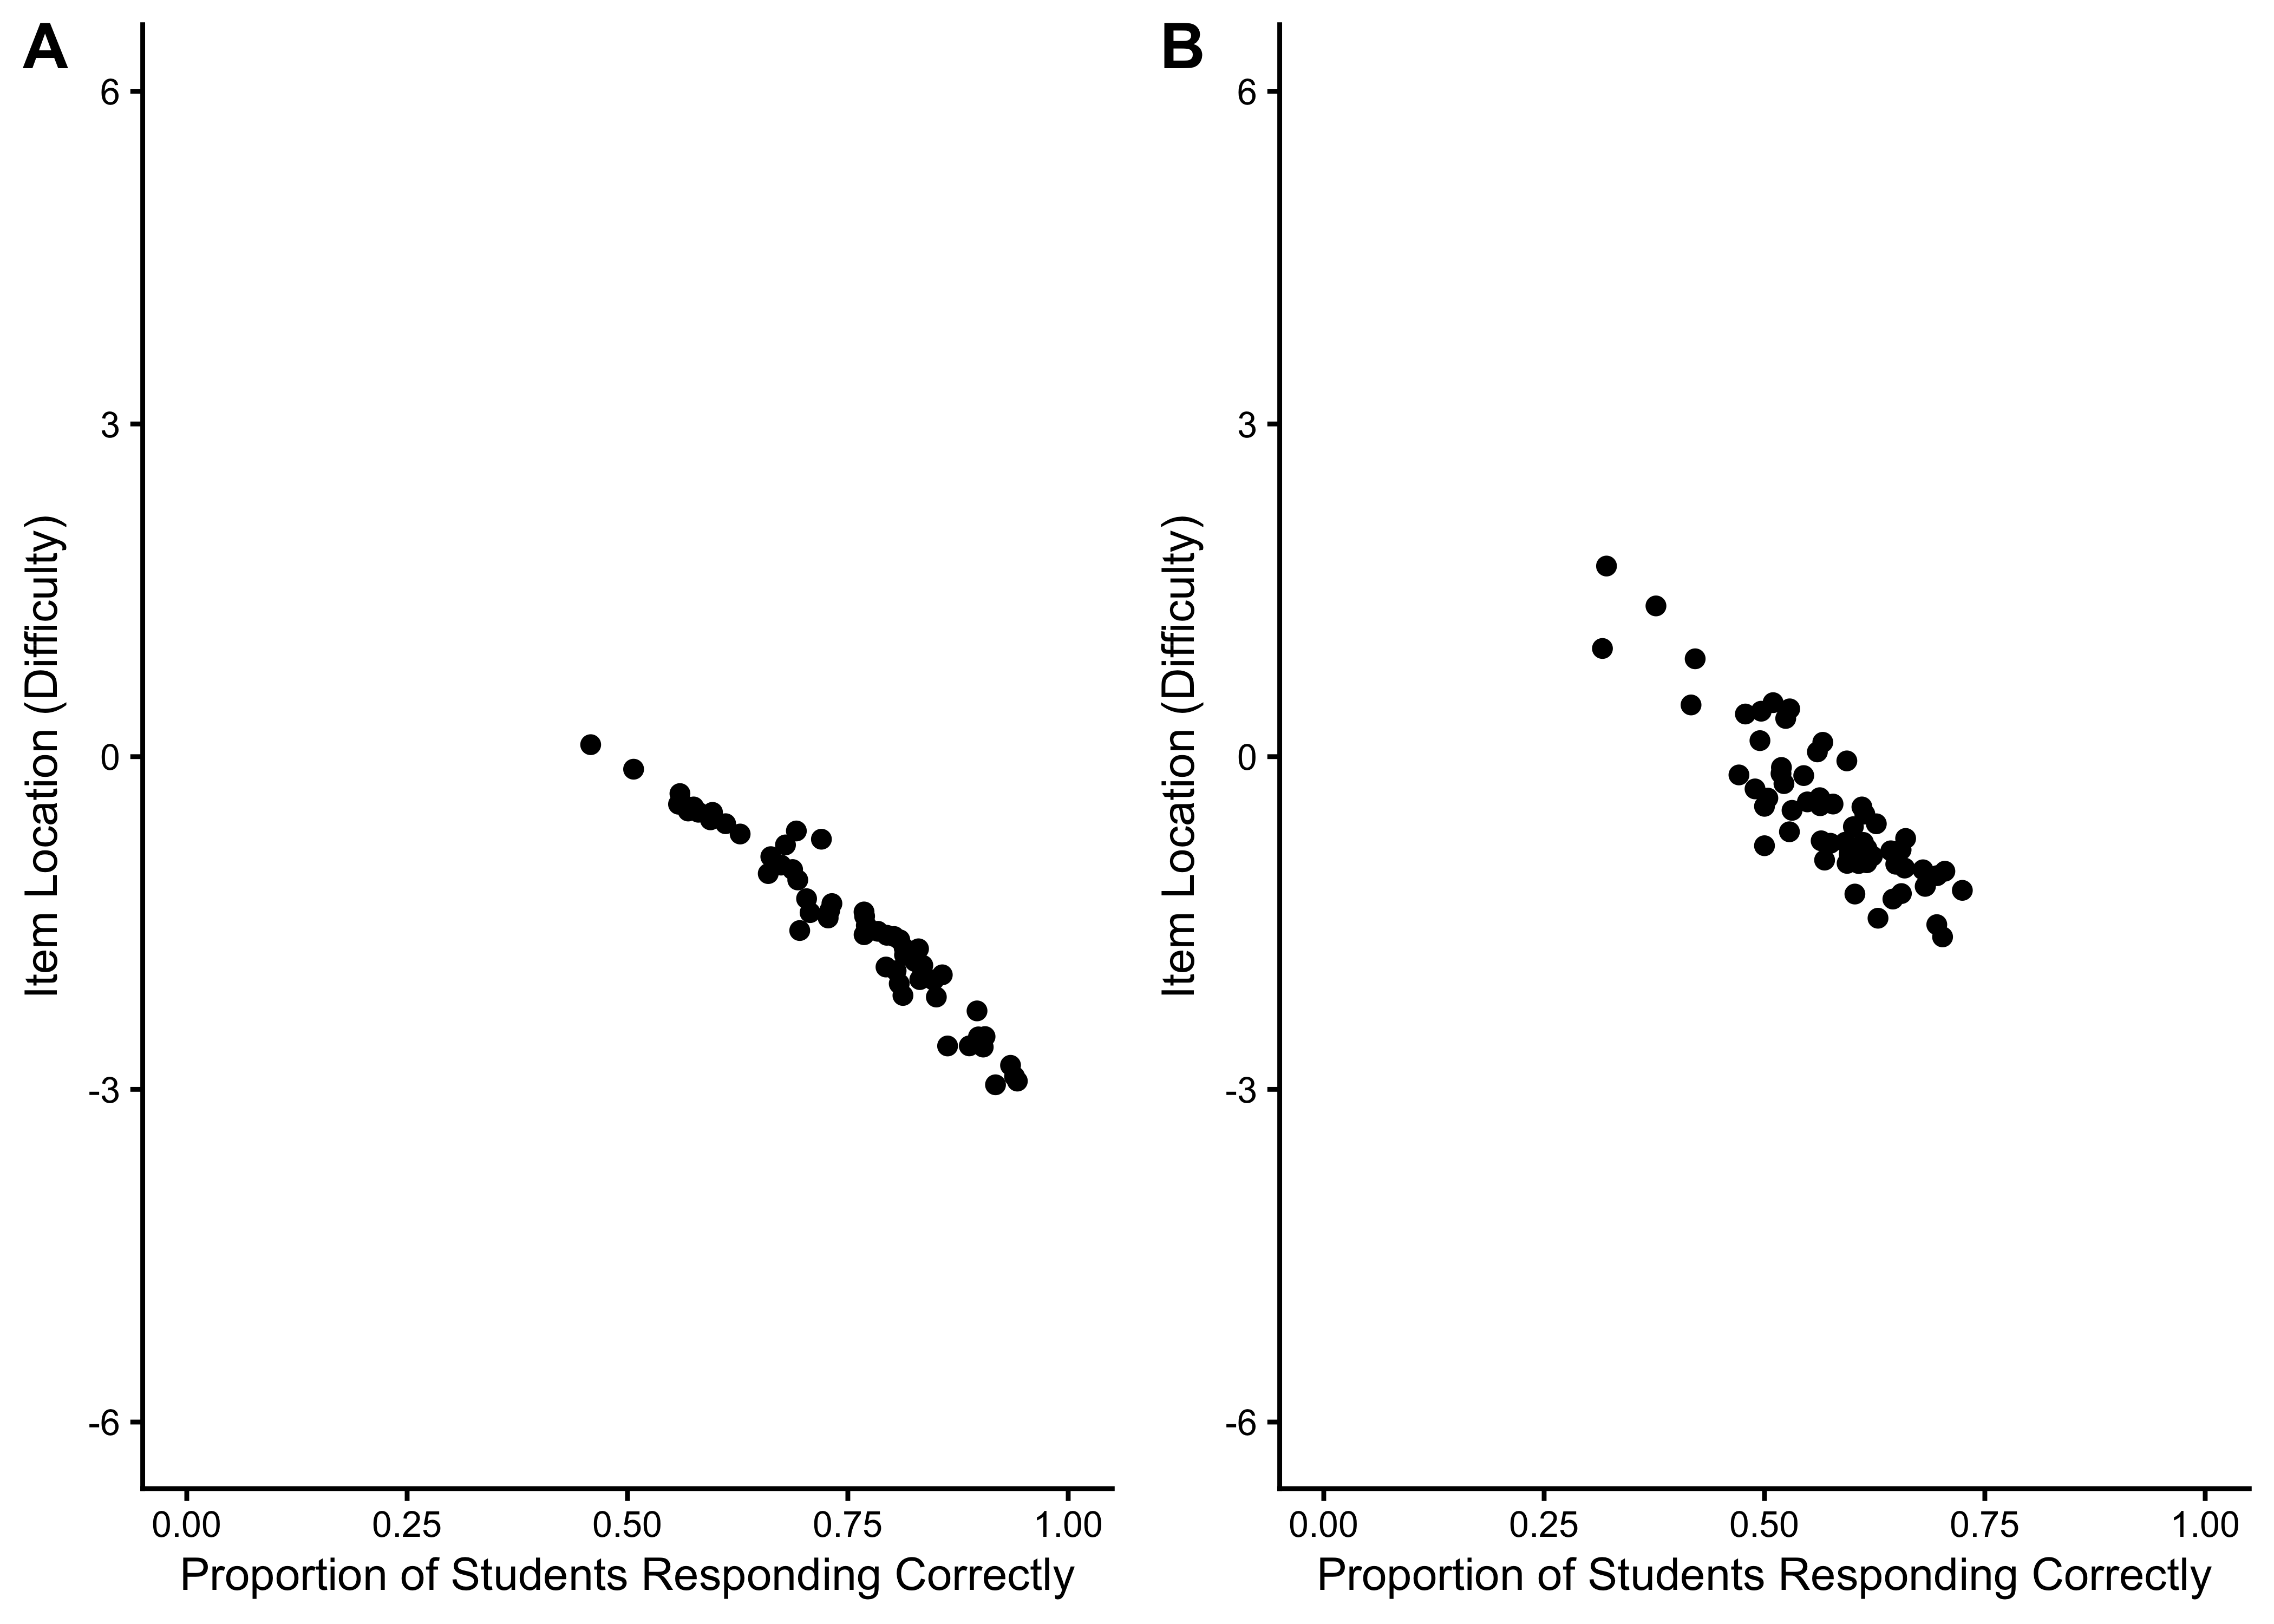
10.6.2.1 Item Location Estimates
10.6.2.2 Item Fit Statistics
| A | B | C | D | Total | A | B | C | D | Total | |
|---|---|---|---|---|---|---|---|---|---|---|
| Outfit MSE | ||||||||||
| A | 57 | 0 | 0 | 0 | 57 | 62 | 0 | 0 | 0 | 62 |
| B | 1 | 0 | 0 | 0 | 1 | 0 | 0 | 0 | 0 | 0 |
| C | 1 | 0 | 0 | 0 | 1 | 0 | 0 | 0 | 0 | 0 |
| D | 0 | 0 | 0 | 0 | 0 | 0 | 0 | 0 | 0 | 0 |
| Total | 59 | 0 | 0 | 0 | 59 | 62 | 0 | 0 | 0 | 62 |
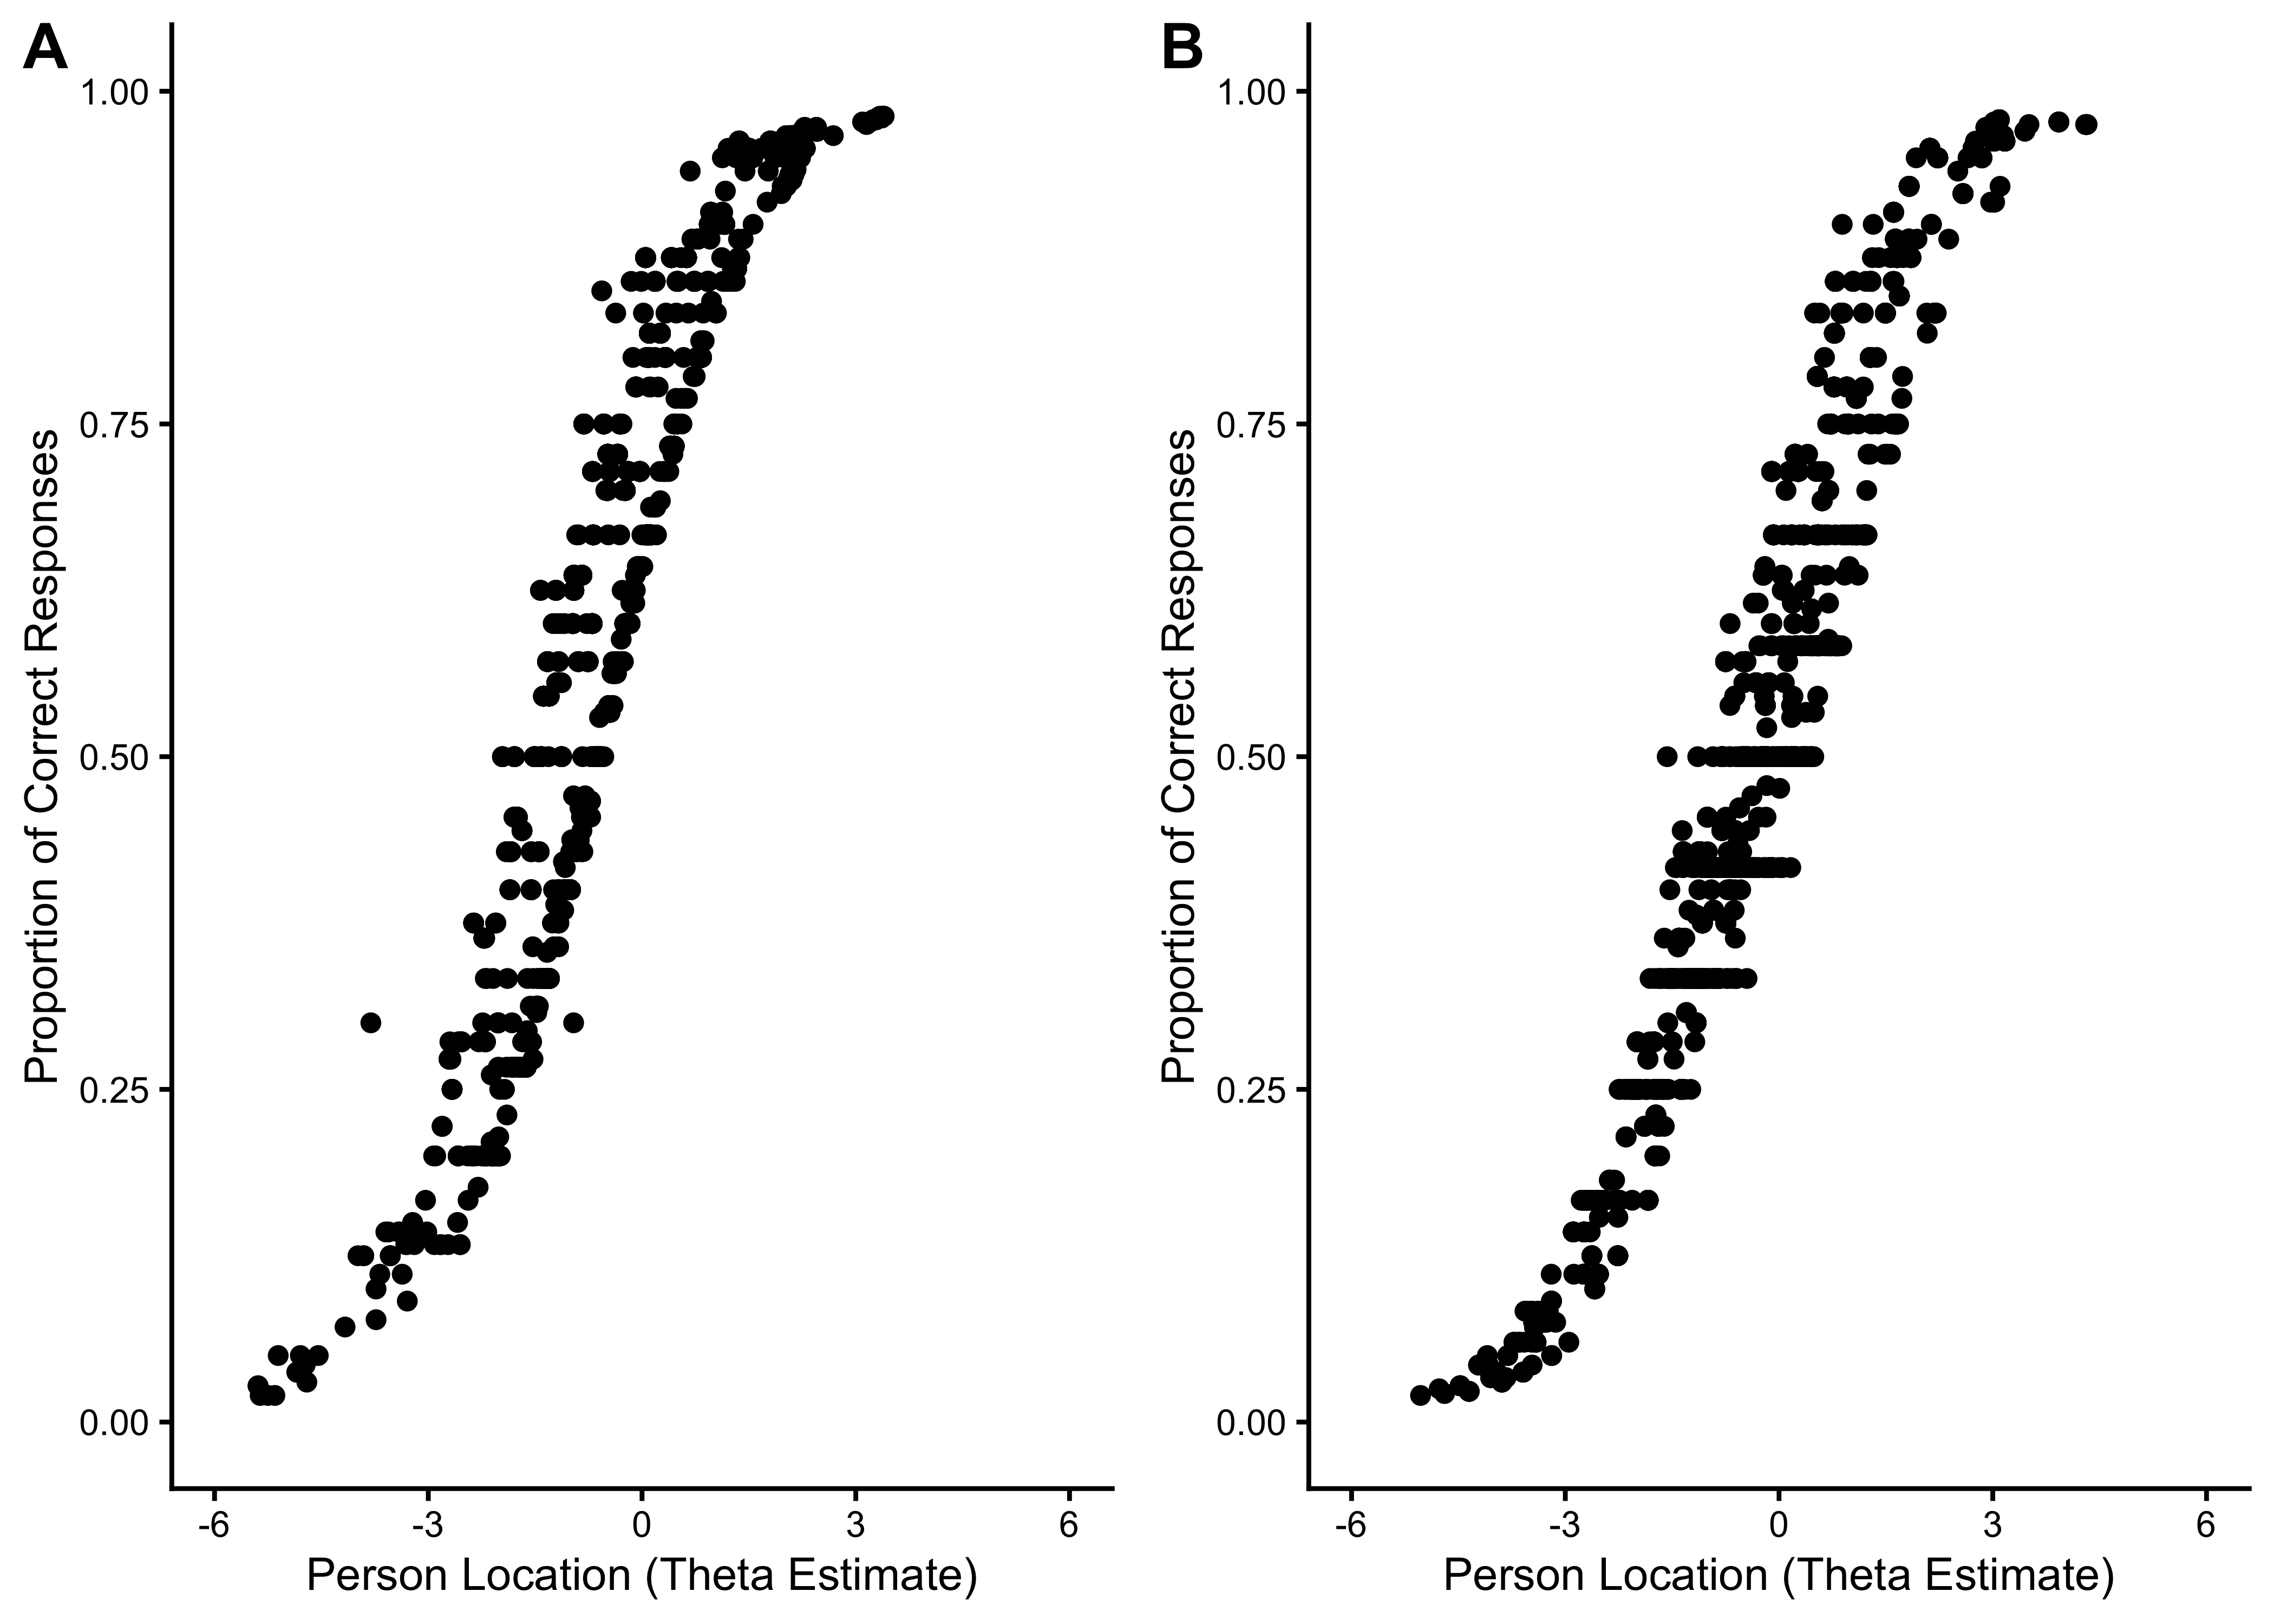
10.6.2.3 Person Location Estimates
10.6.2.4 Person Fit Statistics
| A | B | C | D | Total | A | B | C | D | Total | |
|---|---|---|---|---|---|---|---|---|---|---|
| Outfit MSE | ||||||||||
| A | 2,220 | 0 | 0 | 0 | 2,220 | 1,387 | 0 | 0 | 0 | 1,387 |
| B | 88 | 566 | 0 | 0 | 654 | 45 | 231 | 0 | 0 | 276 |
| C | 39 | 0 | 5 | 0 | 44 | 48 | 0 | 7 | 0 | 55 |
| D | 5 | 0 | 6 | 1 | 12 | 4 | 0 | 4 | 0 | 8 |
| Total | 2,352 | 566 | 11 | 1 | 2,930 | 1,484 | 231 | 11 | 0 | 1,726 |
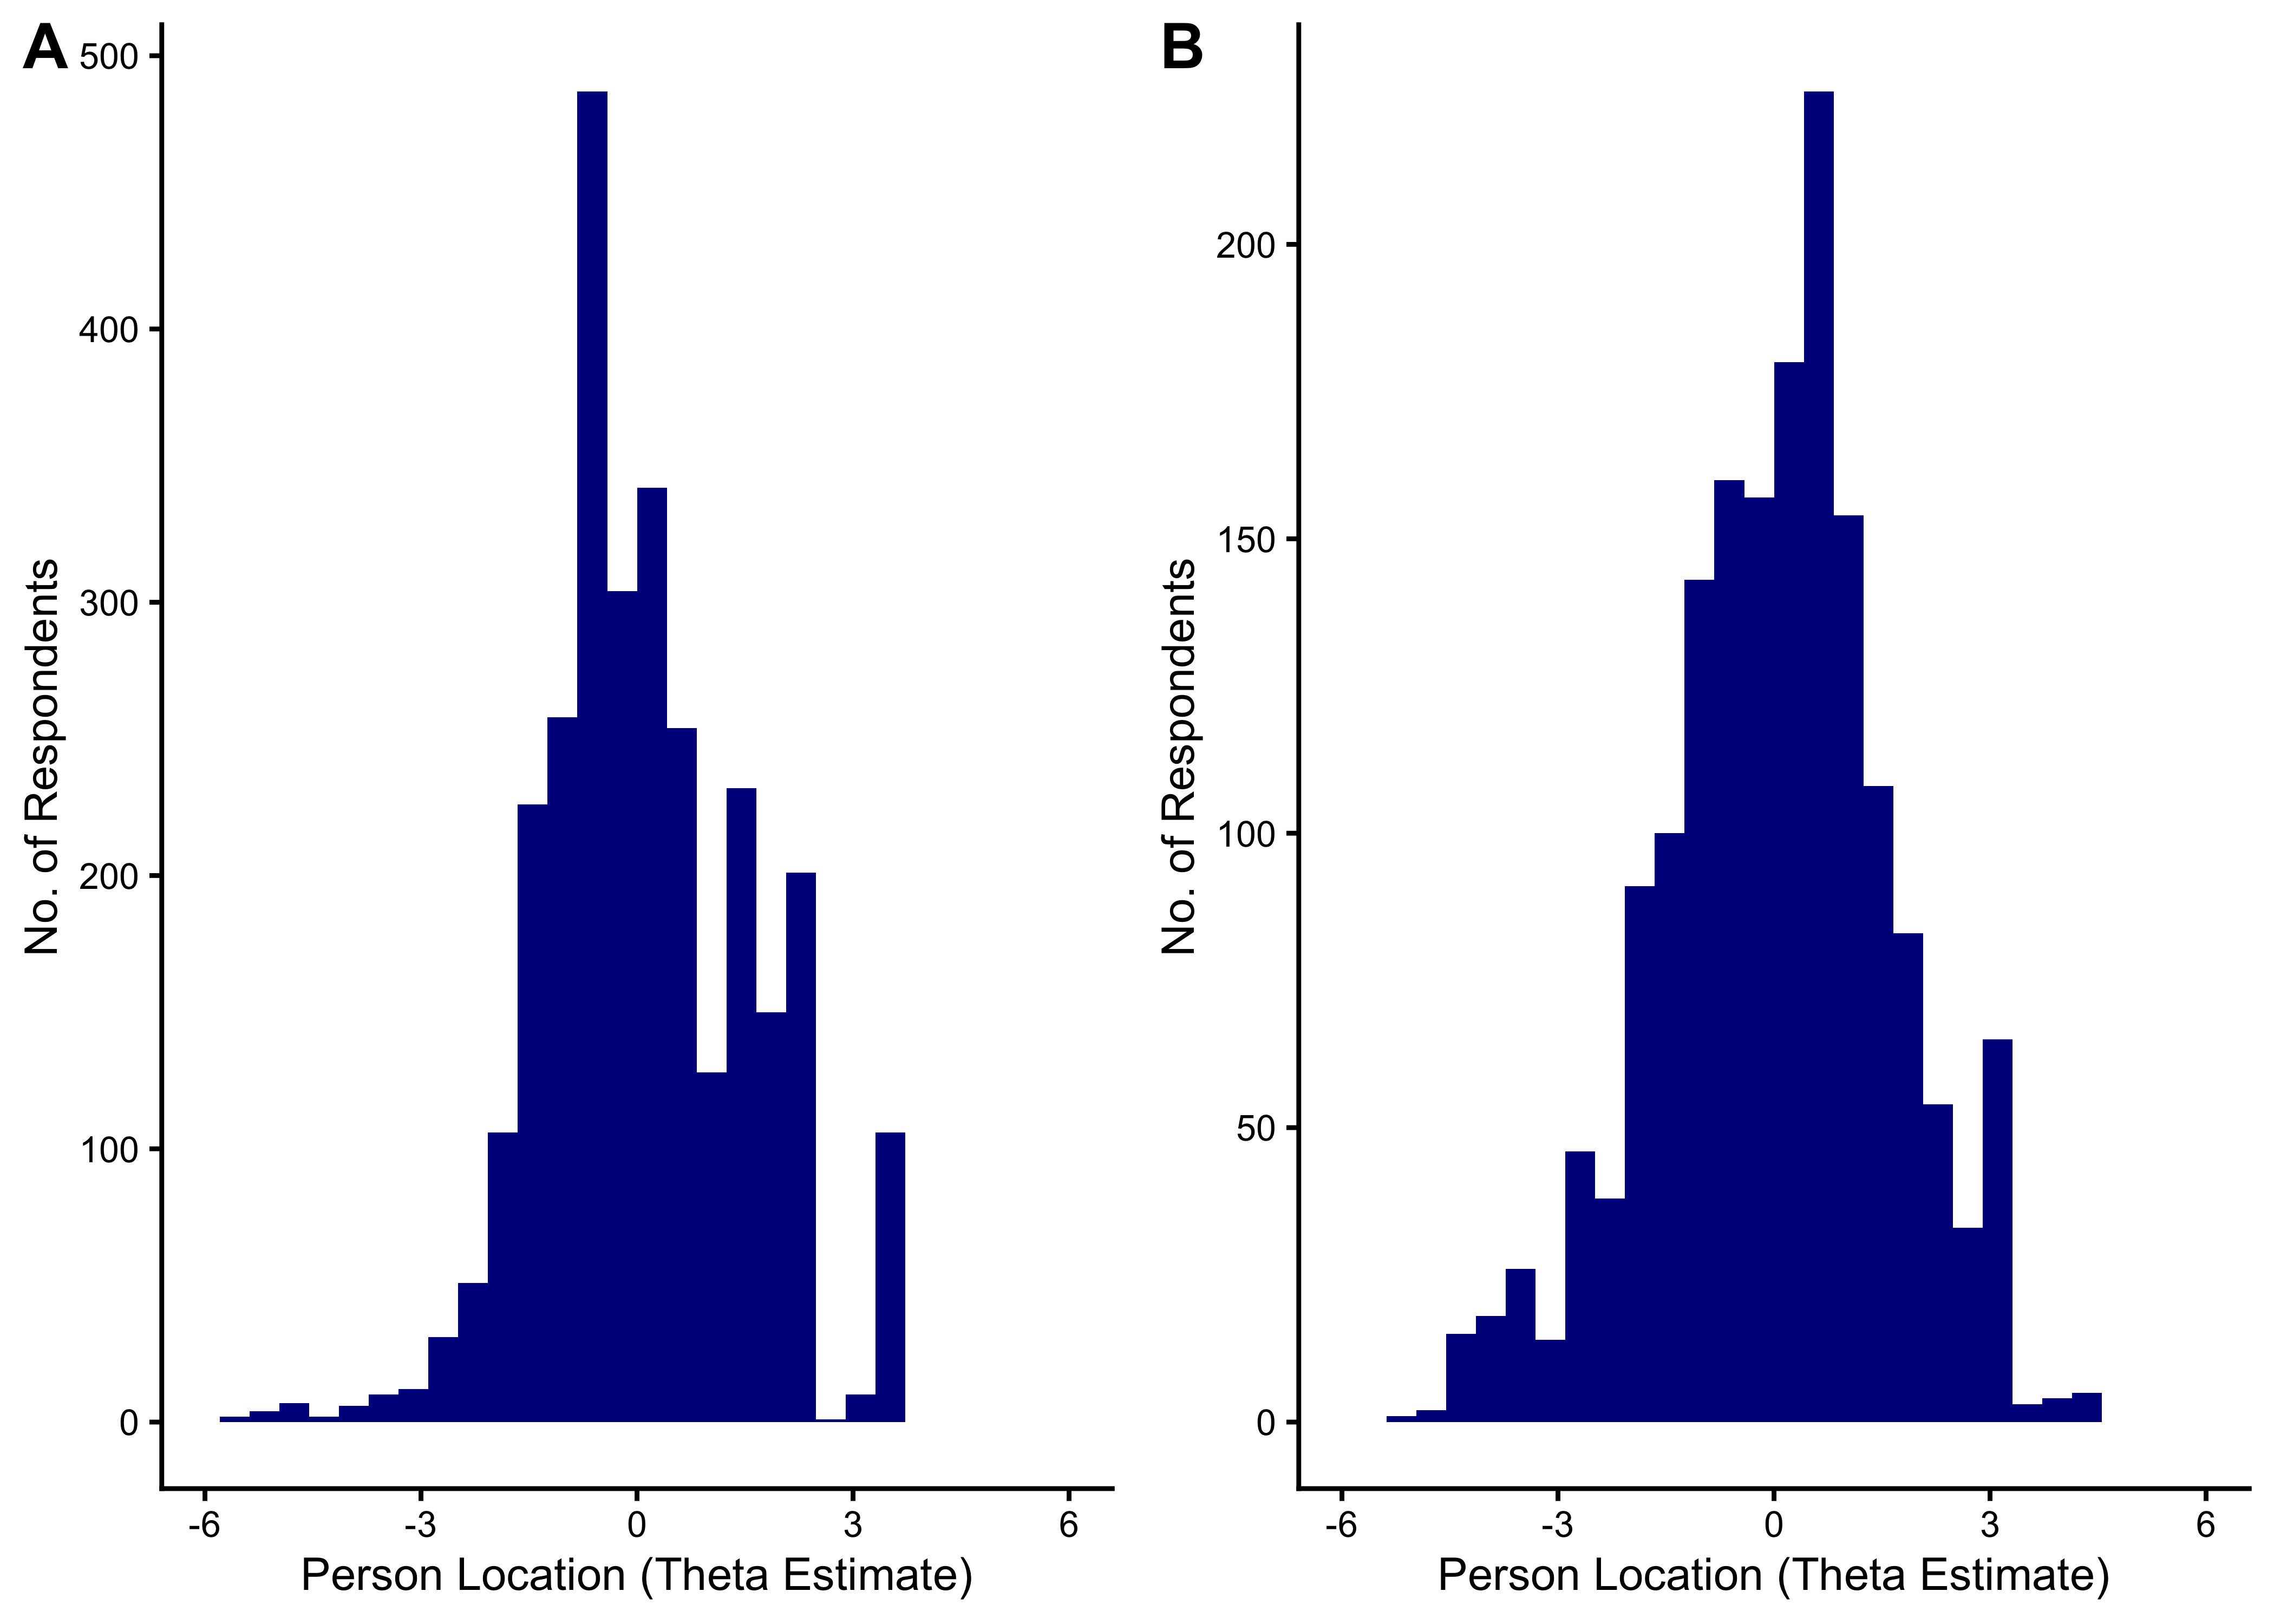
10.6.2.5 Distribution of Theta Estimates
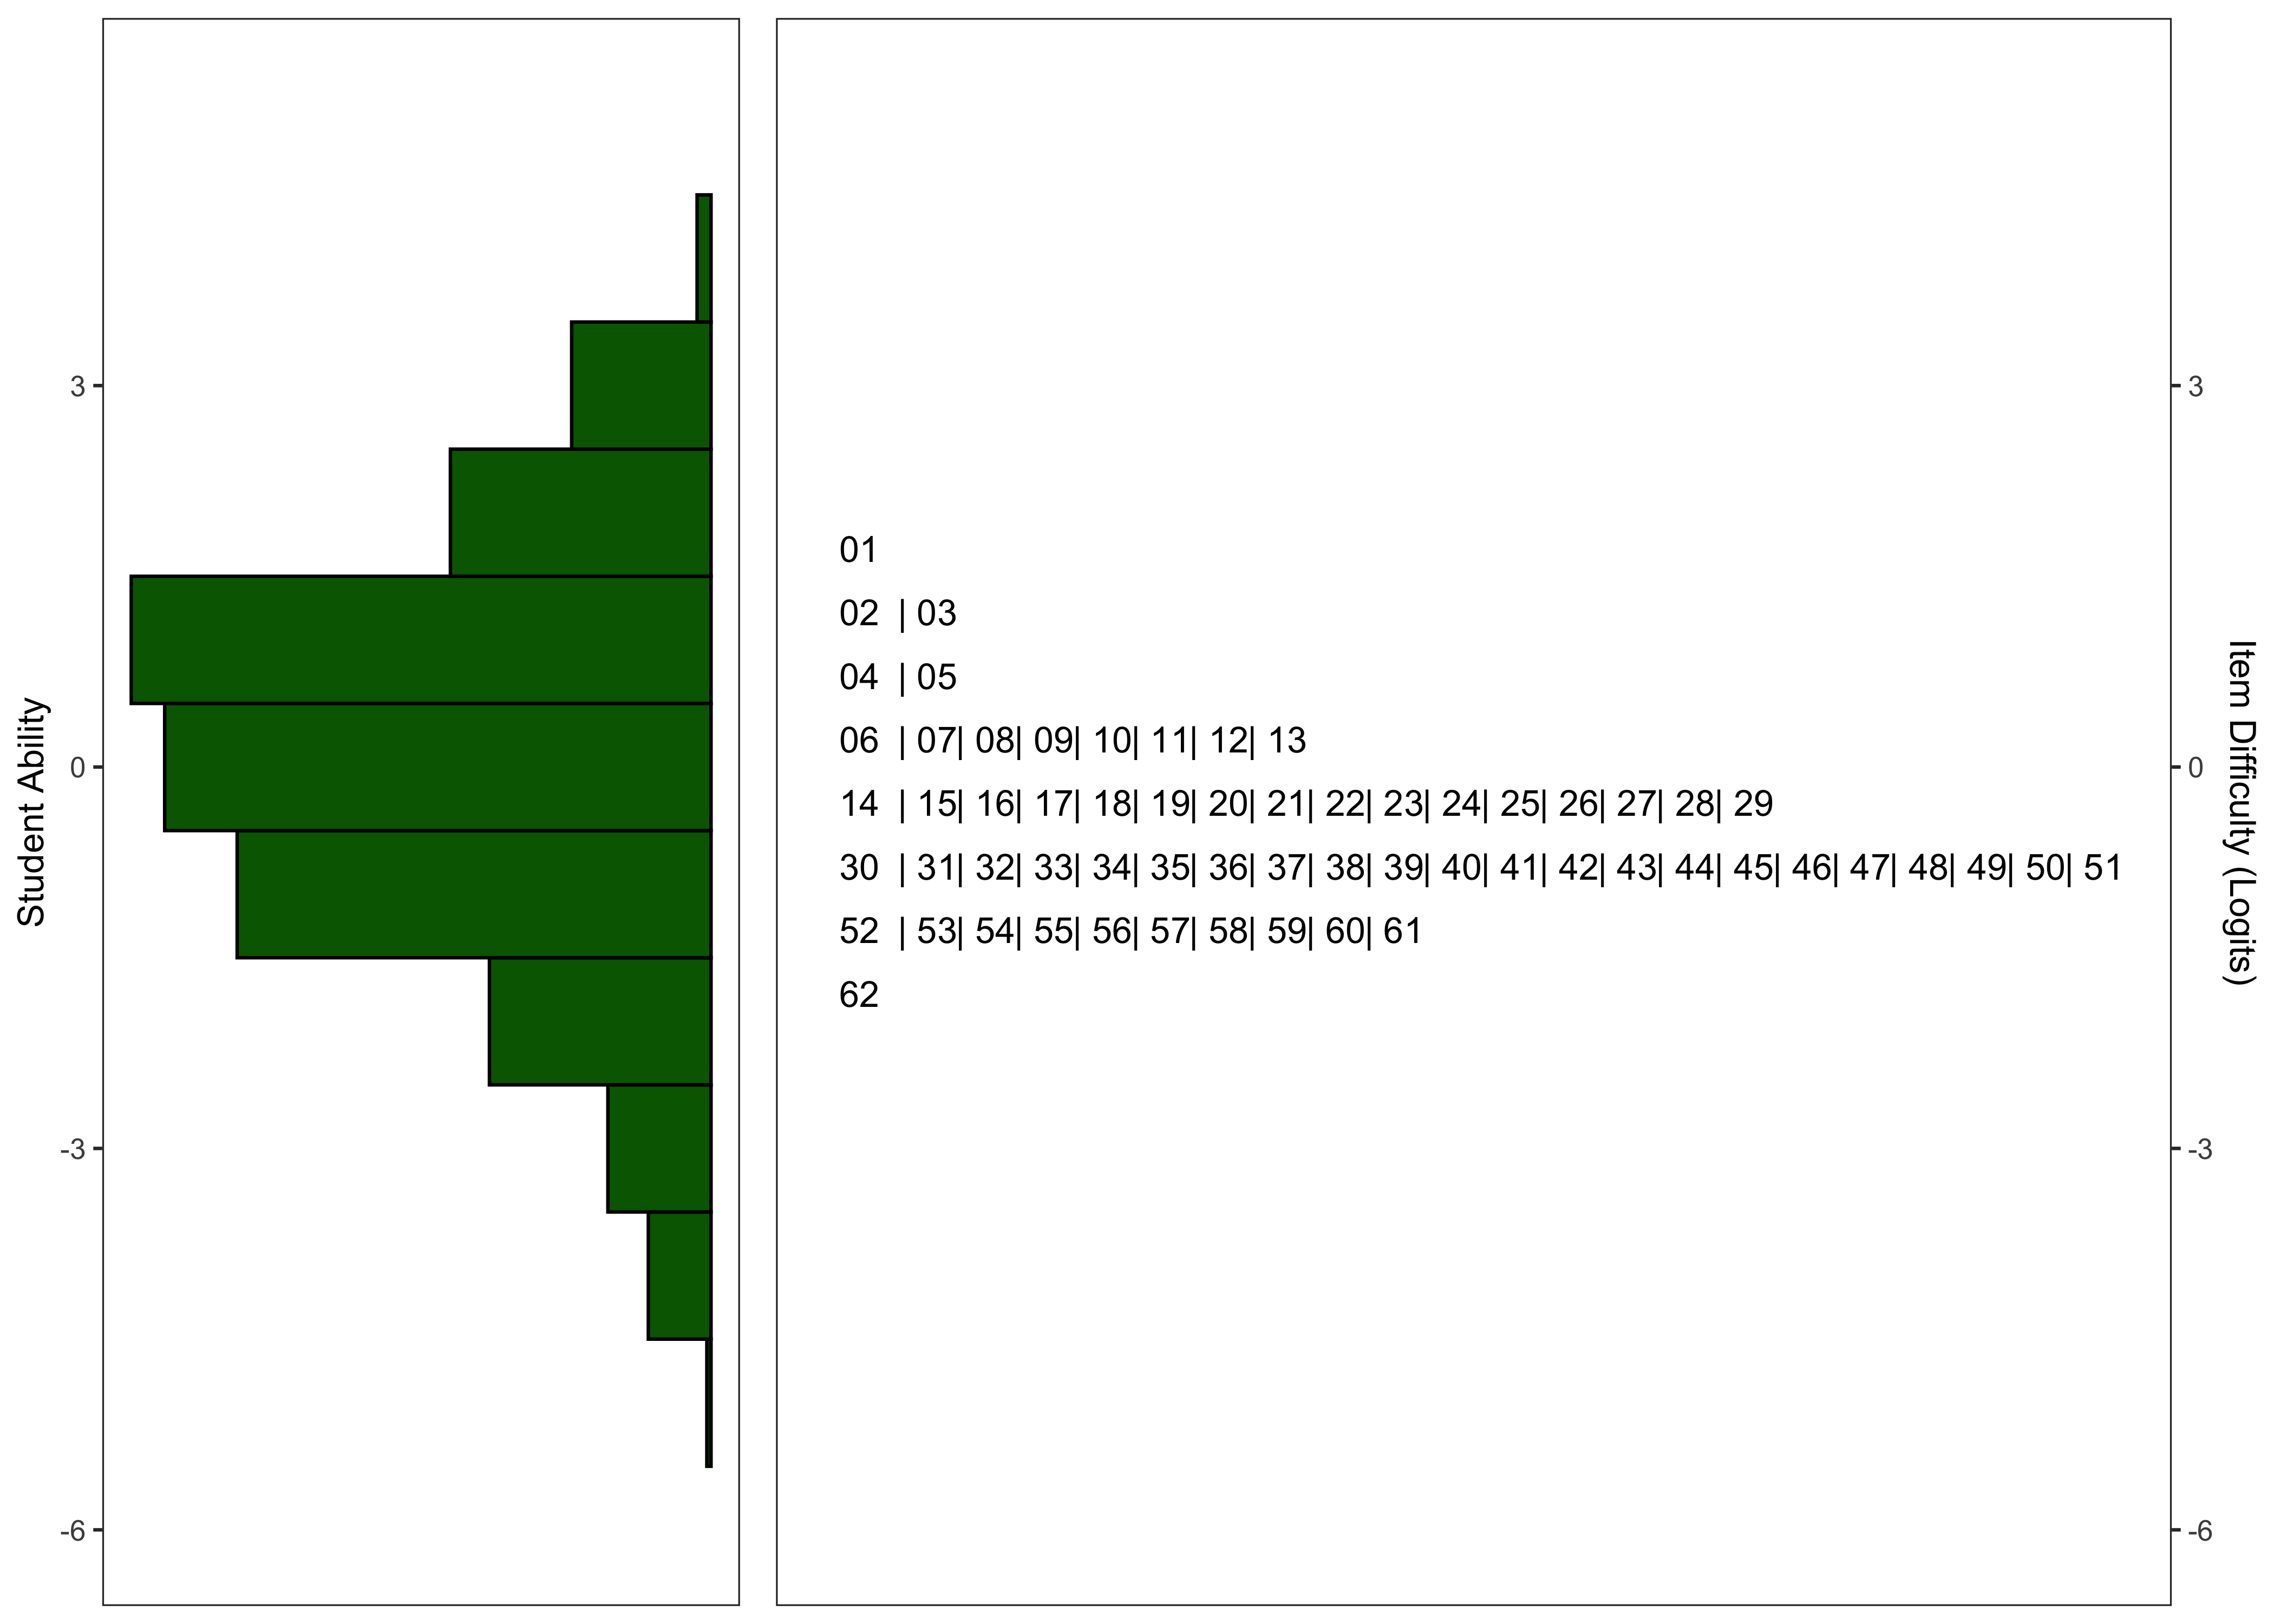
10.6.2.6 Wright Maps
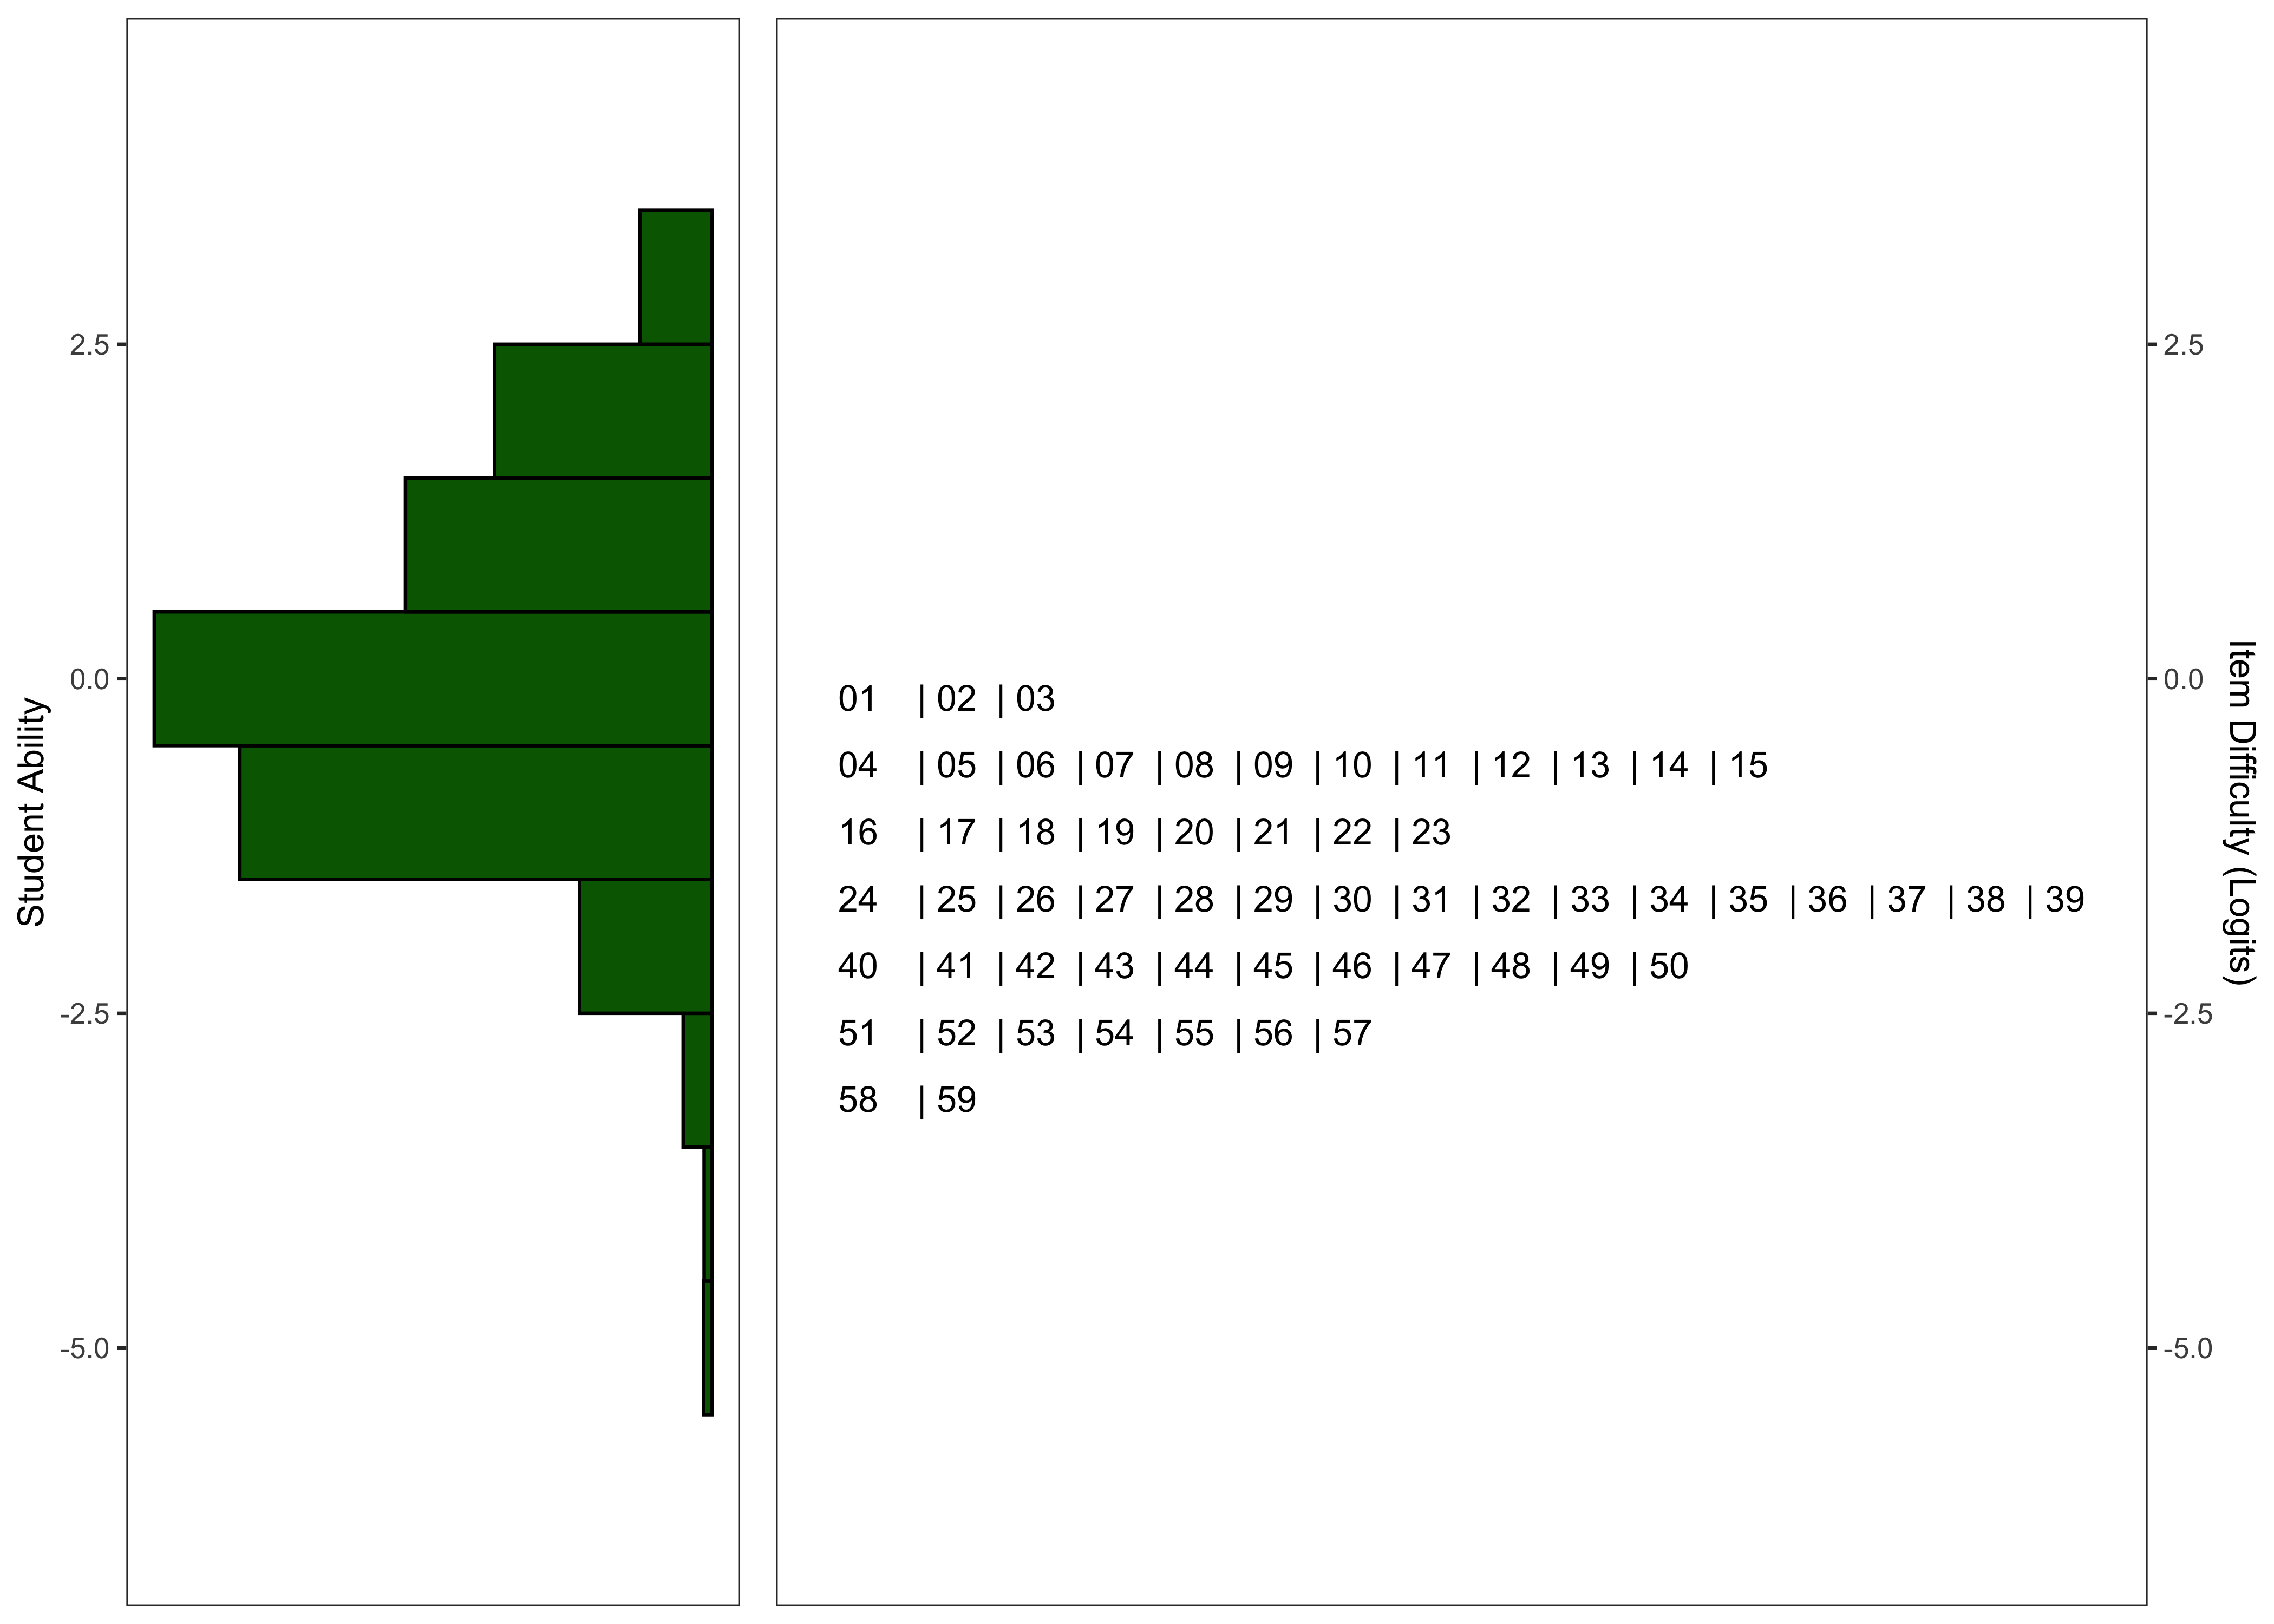
10.6.2.7 Model Summary
| Characteristic | N = 59 | N = 2,930 | N = 62 | N = 1,726 |
|---|---|---|---|---|
| Logit Scale Location | -1.51 (0.78) | -0.09 (-0.80, 0.98) | -0.48 (0.69) | 0.18 (-1.05, 0.97) |
| Outfit | 0.94 (0.18) | 0.88 (0.56, 1.03) | 0.99 (0.17) | 0.86 (0.66, 1.01) |
| Infit | 0.98 (0.08) | 0.90 (0.73, 1.01) | 0.99 (0.11) | 0.88 (0.74, 0.99) |
| Reliability of Separation | 0.6754 | 0.4677 | 0.7243 | 0.6226 |
10.6.2.7.1 Final Number of Items
Following the exclusion of items with point-biserial correlations < .20 and items with poor fit statistics, the final versions of the task contain 59 and 62 for the English and Spanish task, respectively.
10.7 Criterion Validity Evidence
10.7.1 Sample
| Characteristic |
English
|
Spanish
|
||
|---|---|---|---|---|
| K N = 260 |
G1 N = 228 |
K N = 52 |
G1 N = 166 |
|
| Timepoint | ||||
| Winter 2024 | 260 (100%) | 228 (100%) | 52 (100%) | 166 (100%) |
| Race | ||||
| American/Alaskan Native | 5 (1.9%) | 3 (1.3%) | 0 (0%) | 4 (2.4%) |
| Asian | 35 (14%) | 37 (16%) | 2 (3.8%) | 2 (1.2%) |
| Black/African American | 29 (11%) | 28 (12%) | ||
| Not reported | 29 (11%) | 32 (14%) | 28 (54%) | 116 (71%) |
| Other | 73 (28%) | 44 (19%) | 11 (21%) | 5 (3.0%) |
| White | 86 (33%) | 84 (37%) | 11 (21%) | 37 (23%) |
| Unknown | 3 | 0 | 0 | 2 |
| Ethnicity | ||||
| Hispanic/Latin(o/a) | 106 (41%) | 96 (42%) | 47 (90%) | 155 (93%) |
| Intentional nonreport | 7 (2.7%) | 2 (0.9%) | ||
| Not Hispanic/Latin(o/a) | 147 (57%) | 130 (57%) | 5 (9.6%) | 11 (6.6%) |
| Gender | ||||
| Female | 130 (50%) | 105 (46%) | 33 (63%) | 82 (49%) |
| Male | 130 (50%) | 123 (54%) | 19 (37%) | 84 (51%) |
| Home Language | ||||
| English | 191 (75%) | 170 (75%) | 6 (12%) | 17 (10%) |
| Spanish | 33 (13%) | 25 (11%) | 45 (87%) | 146 (89%) |
| Other | 31 (12%) | 32 (14%) | 1 (1.9%) | 1 (0.6%) |
| Unknown | 5 | 1 | 0 | 2 |
| English Proficiency Label | ||||
| (Re-)Classified Proficient | 11 (5.1%) | 18 (8.1%) | 6 (12%) | 19 (12%) |
| English Learner | 48 (22%) | 40 (18%) | 41 (84%) | 129 (79%) |
| English-only | 156 (73%) | 165 (74%) | 2 (4.1%) | 16 (9.8%) |
| Unknown | 45 | 5 | 3 | 2 |
| Ever IEP/504 | 20 (10.0%) | 22 (12%) | 1 (2.3%) | 11 (7.1%) |
| Unknown | 59 | 48 | 9 | 11 |
English Elision-Receptive was correlated with the Elision subtest from the Comprehensive Test of Phonological Processing, 2nd Edition (Wagner et al. 2013). Spanish Elision-Receptive was correlated with the Deletion subtest from the Test of Phonological Awareness in Spanish (TPAS) (Riccio et al. 2004).
| Grade | n | r [CI] | n | r [CI] | n | r [CI] |
|---|---|---|---|---|---|---|
| K | 260 | 0.50 [0.40, 0.58] | 48 | 0.54 [0.31, 0.72] | 52 | 0.57 [0.35, 0.73] |
| G1 | 228 | 0.49 [0.38, 0.58] | 40 | 0.31 [-0.01, 0.56] | 166 | 0.40 [0.27, 0.52] |