| Characteristic |
English
|
Spanish
|
|---|---|---|
| G2 N = 2,805 |
G2 N = 299 |
|
| Timepoint | ||
| Fall 2024 | 2,191 (100%) | 0 (NA%) |
| Unknown | 614 | 299 |
| Administration Format | ||
| CAT | 2,191 (78%) | |
| Forms | 614 (22%) | 299 (100%) |
| Race | ||
| American/Alaskan Native | 54 (2.1%) | 4 (1.3%) |
| Asian | 179 (6.9%) | 3 (1.0%) |
| Black/African American | 259 (10%) | 4 (1.3%) |
| Not reported | 310 (12%) | 156 (53%) |
| Other | 365 (14%) | 14 (4.7%) |
| White | 1,420 (55%) | 116 (39%) |
| Unknown | 218 | 2 |
| Ethnicity | ||
| Hispanic/Latin(o/a) | 1,886 (74%) | 264 (88%) |
| Intentional nonreport | 5 (0.2%) | 1 (0.3%) |
| Not Hispanic/Latin(o/a) | 668 (26%) | 34 (11%) |
| Unknown | 246 | |
| Gender | ||
| Female | 1,255 (49%) | 173 (58%) |
| Male | 1,291 (51%) | 126 (42%) |
| Unknown | 259 | |
| Home Language | ||
| English | 1,426 (59%) | 71 (24%) |
| Spanish | 890 (37%) | 216 (74%) |
| Other | 91 (3.8%) | 5 (1.7%) |
| Unknown | 398 | 7 |
| English Proficiency Label | ||
| (Re-)Classified Proficient | 268 (11%) | 40 (14%) |
| English Learner | 701 (30%) | 186 (64%) |
| English-only | 1,405 (59%) | 66 (23%) |
| Unknown | 431 | 7 |
| Ever IEP/504 | 210 (10%) | 24 (9.5%) |
| Unknown | 784 | 46 |
22 Spelling
22.1 Task Description
The child hears a word and spells it by selecting the correct letters among the foils available on the screen and drags them to the bottom of the screen in the correct order.
22.2 Construct
The Spelling task measures the children’s ability to put the alphabetic principle into action and encode speech sounds into print.
22.3 Item Development
22.3.1 English
For the development of the item pool, the research team reviewed multiple curricula to build up a list of frequent, decodable words, including curricula used in the United States, like McGraw-Hill’s “Wonders”, Benchmark’s “Benchmark Advance”, and HMH’s “Journey”.
From this pool of items, Clearpond (Marian et al. 2012) was used to retrieve information on the word’s frequency, orthographic and phonological length, and neighborhood frequency. This information was used to select a sample of hihg frequency words whose semantic meaning was overall easily accessed by the target population, with varying orthographic and phonological length. The final list of words also targeted the following characteristics: short, long, and variant vowels; r-controlled vowels; use of soft c and g; silent letters (e.g., /bm/, /sc/); diphthongs; consonant digraphs; two and three-letter blends; closed, open, and CVC syllables.
Using the letters of each target word as reference, the research team selected between 3 and 5 foil letters to be included among the correct letters for spelling the word. Foil letters were selected based on different criteria:
- Phonological foils: letters with similarly-sounding phonemes as the target letter (e.g., z for s; c for k; v for b)
- Visual foils: letters visually similar to the target letter (e.g., d for b; m for n)
- Vocalic foils: alternative vowels to the targeted ones (e.g., o for a; e for i)
- Morphological foils: alternative spelling of a conventional morpheme (e.g., z for s, t for ed for past tense verbs)
- Unrelated foils: additional foils were included in the pool that were not easily confused with the letters needed to spell the target word.
22.3.2 Spanish
For the development of the item pool, the research team reviewed multiple curricula to build up a list of frequent, decodable words, including curricula used in dual language programs in California, including McGraw-Hill Maravillas, Estrellita, Houghton Mifflin Lectura. Curricular materials from Mexico, Panama, and Chile were also reviewed.
From this pool of items, Clearpond (Marian et al. 2012) was used to retrieve information on the word’s frequency, orthographic and phonological length, and neighborhood frequency. This information was used to select a sample of words that were high frequency, whose semantic meaning was overall easily accessed by the target population, and that had varying orthographic and phonological lengths.
Using the letters of each target word as reference, the research team selected between 3 and 5 foil letters to be included among the correct letters for spelling the word. Foils letters were based on different criteria:
- Phonological foils: letters that sound similar to the target letter (e.g., z for s; c for k; v for b)
- Visual foils: letters that are visually similar to the target letter (e.g., d for b; m for n)
- Vocalic foils: alternative vowels to the targeted ones (e.g., o for a; e for i)
- Stress foils: Spanish language uses accents for stressed letters and the child had to discern if the word contained the accented or nonaccented letter (e.g., é for e; a for á)
- Crosslinguistic English phonology foils: phonemes that are represented with a different letter in English than they are in Spanish (e.g., th for d)
- Unrelated foils: additional foils were included in the pool that were not easily confused with the letters needed to speall the target word.
22.4 Scoring
Dichotomous fixed response format of 0 points for incorrect responses or non-responses and 1 point for correct ones.
22.5 Calibration Samples
22.6 Psychometric Analysis
22.6.1 Basic Item Statistics
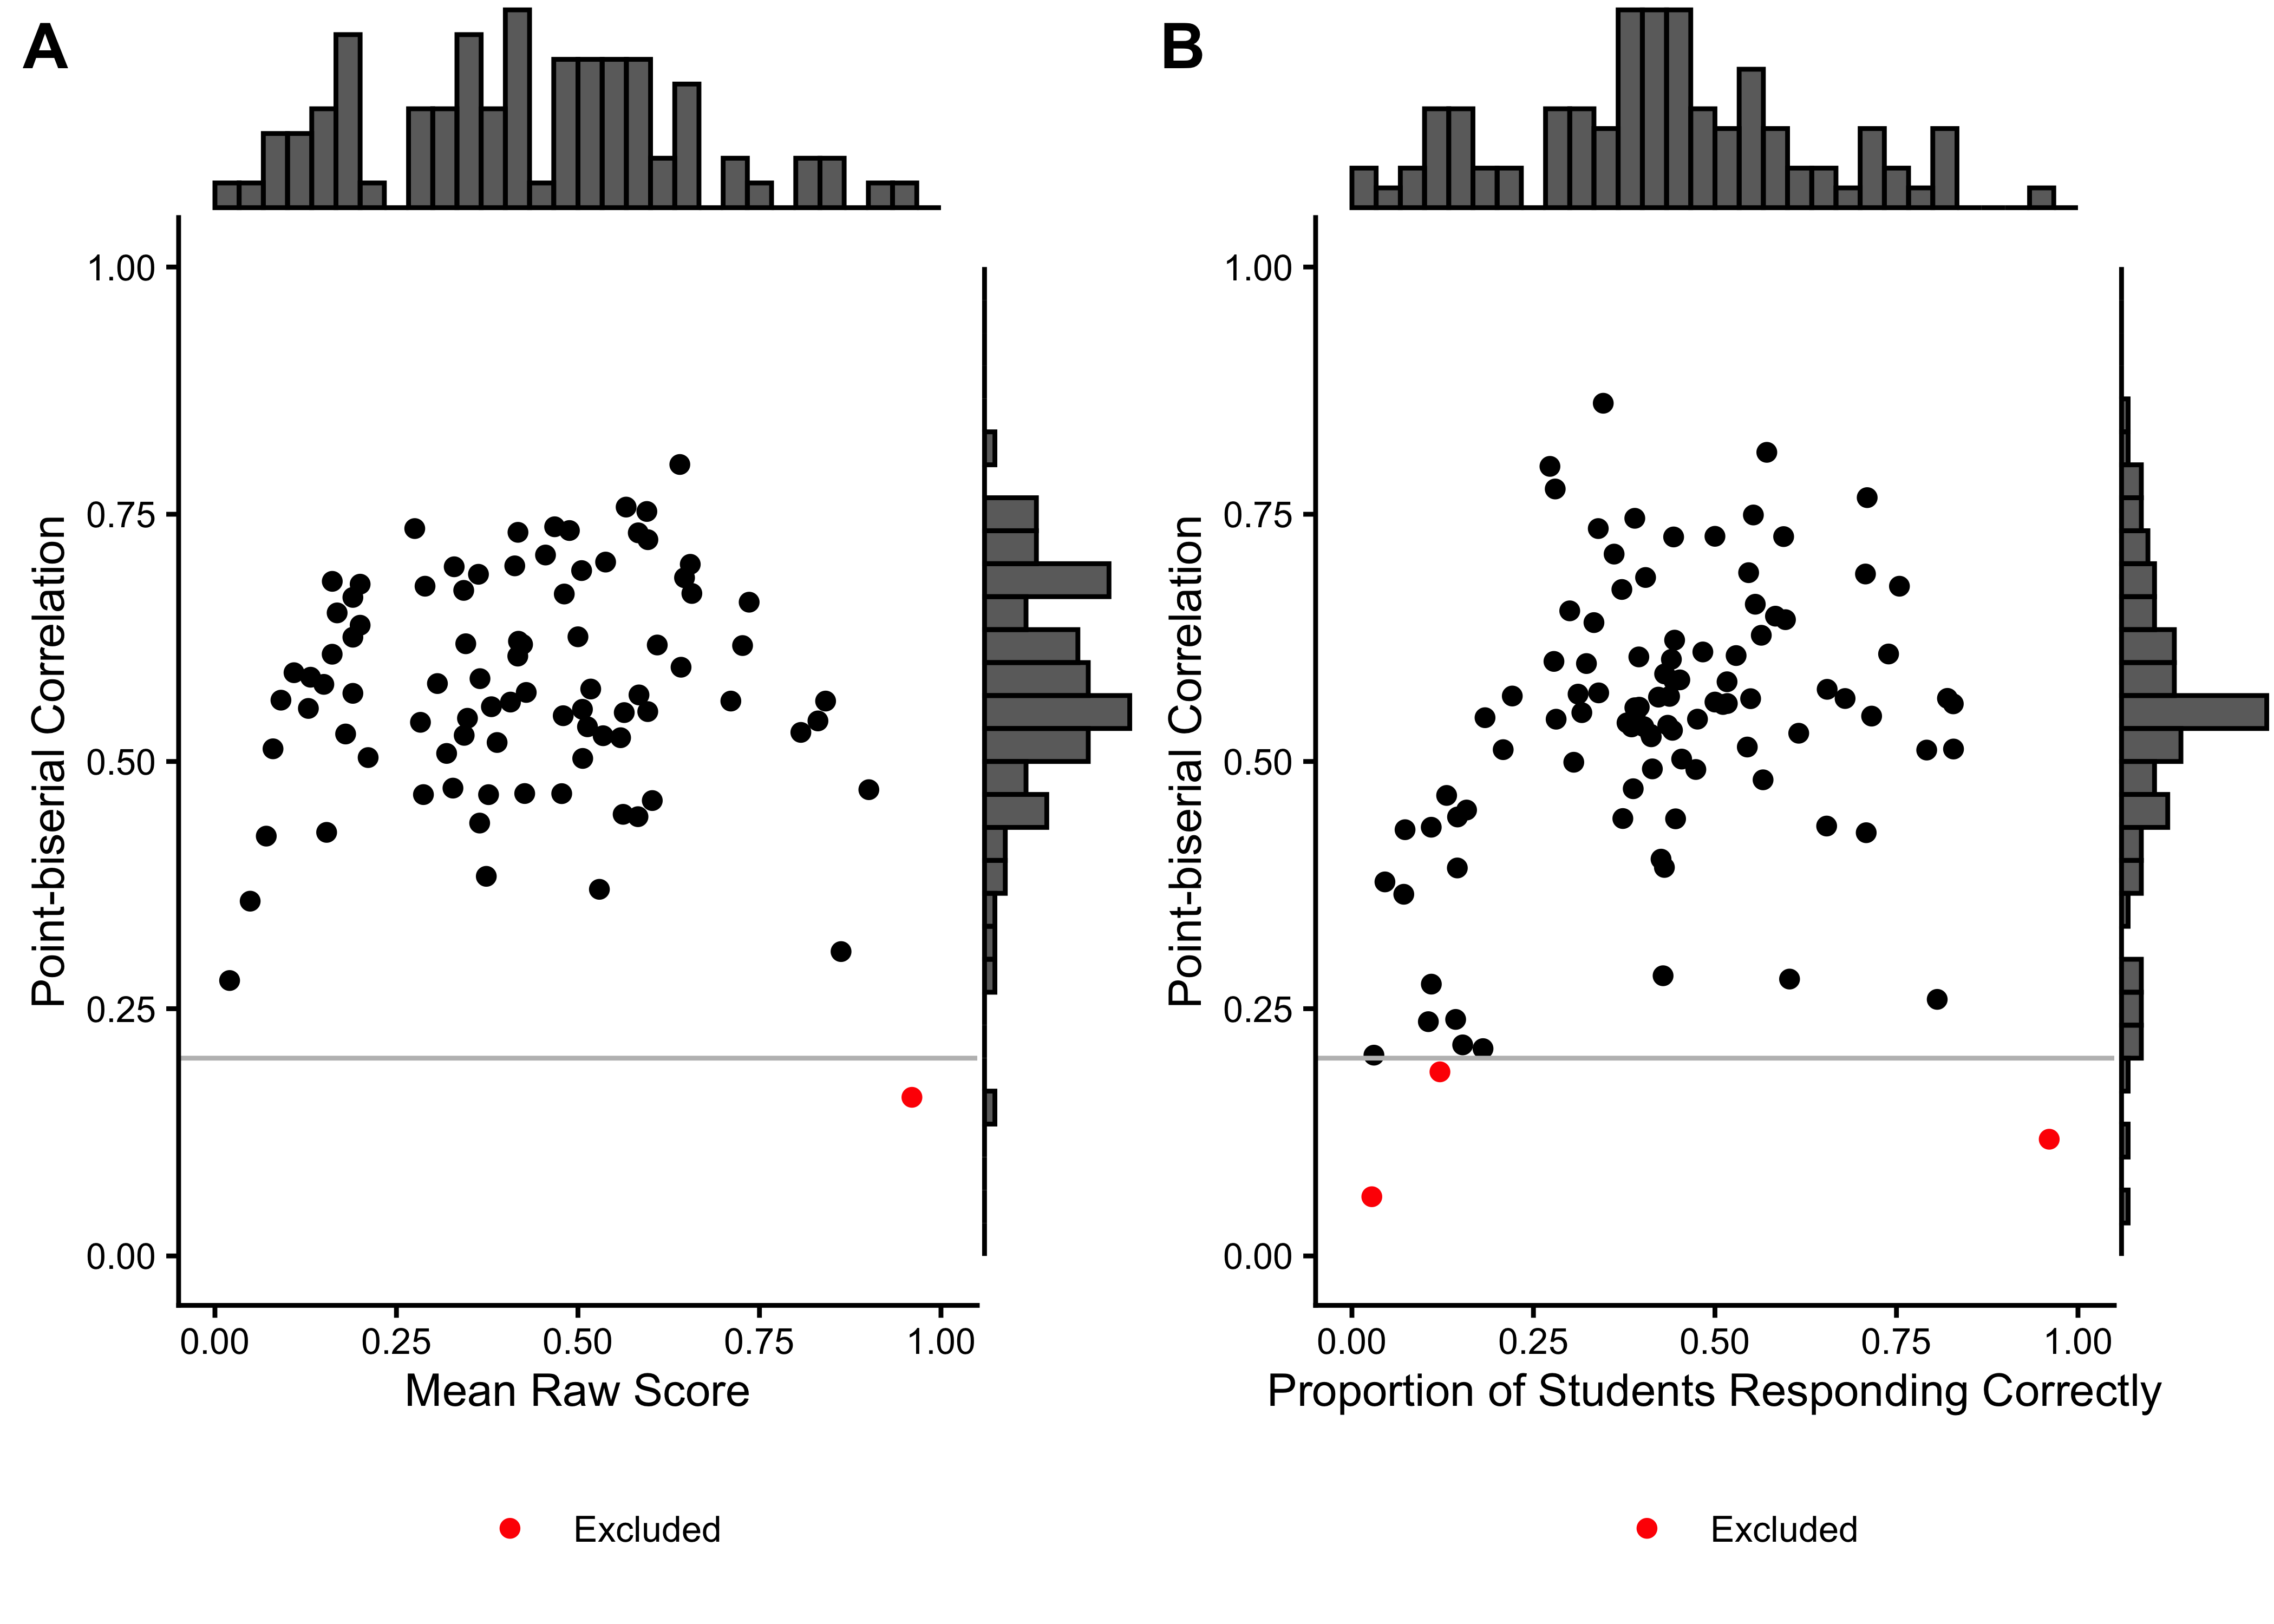
We excluded 0 items from the English task and 9 items from the Spanish task based on low response counts (n < 90). 2 items were excluded because they had no variance in the Spanish task, and 2 items in the English task. Additionally, we excluded 1 items from the English task and 3 items from the Spanish task based on low point-biserial correlations (r < 0.2). Table 22.2 summarizes the basic item characteristics, Figure 22.1 shows the relationship between point-biserial correlations and the proportion of correct responses for each item.
English
|
Spanish
|
|||
|---|---|---|---|---|
| Characteristic |
Before Excl.
|
After Excl.
|
Before Excl.
|
After Excl.
|
| N = 90 | N = 87 | N = 102 | N = 88 | |
| No. of Responses | 440 (371) | 452 (372) | 120 (84) | 132 (83) |
| Proportion Correct | 0.42 (0.22) | 0.42 (0.21) | 0.42 (0.21) | 0.43 (0.19) |
| Point-biserial Correlation | 0.57 (0.12) | 0.58 (0.11) | 0.53 (0.16) | 0.54 (0.13) |
| Excluded (n < 90) | 0 (0%) | 0 (0%) | 9 (8.8%) | 0 (0%) |
| Excluded (pbis < .2) | 1 (1.1%) | 0 (0%) | 3 (3.0%) | 0 (0%) |
| Excluded (no variation) | 2 (2.2%) | 0 (0%) | 2 (2.0%) | 0 (0%) |
22.6.2 Rasch Analysis
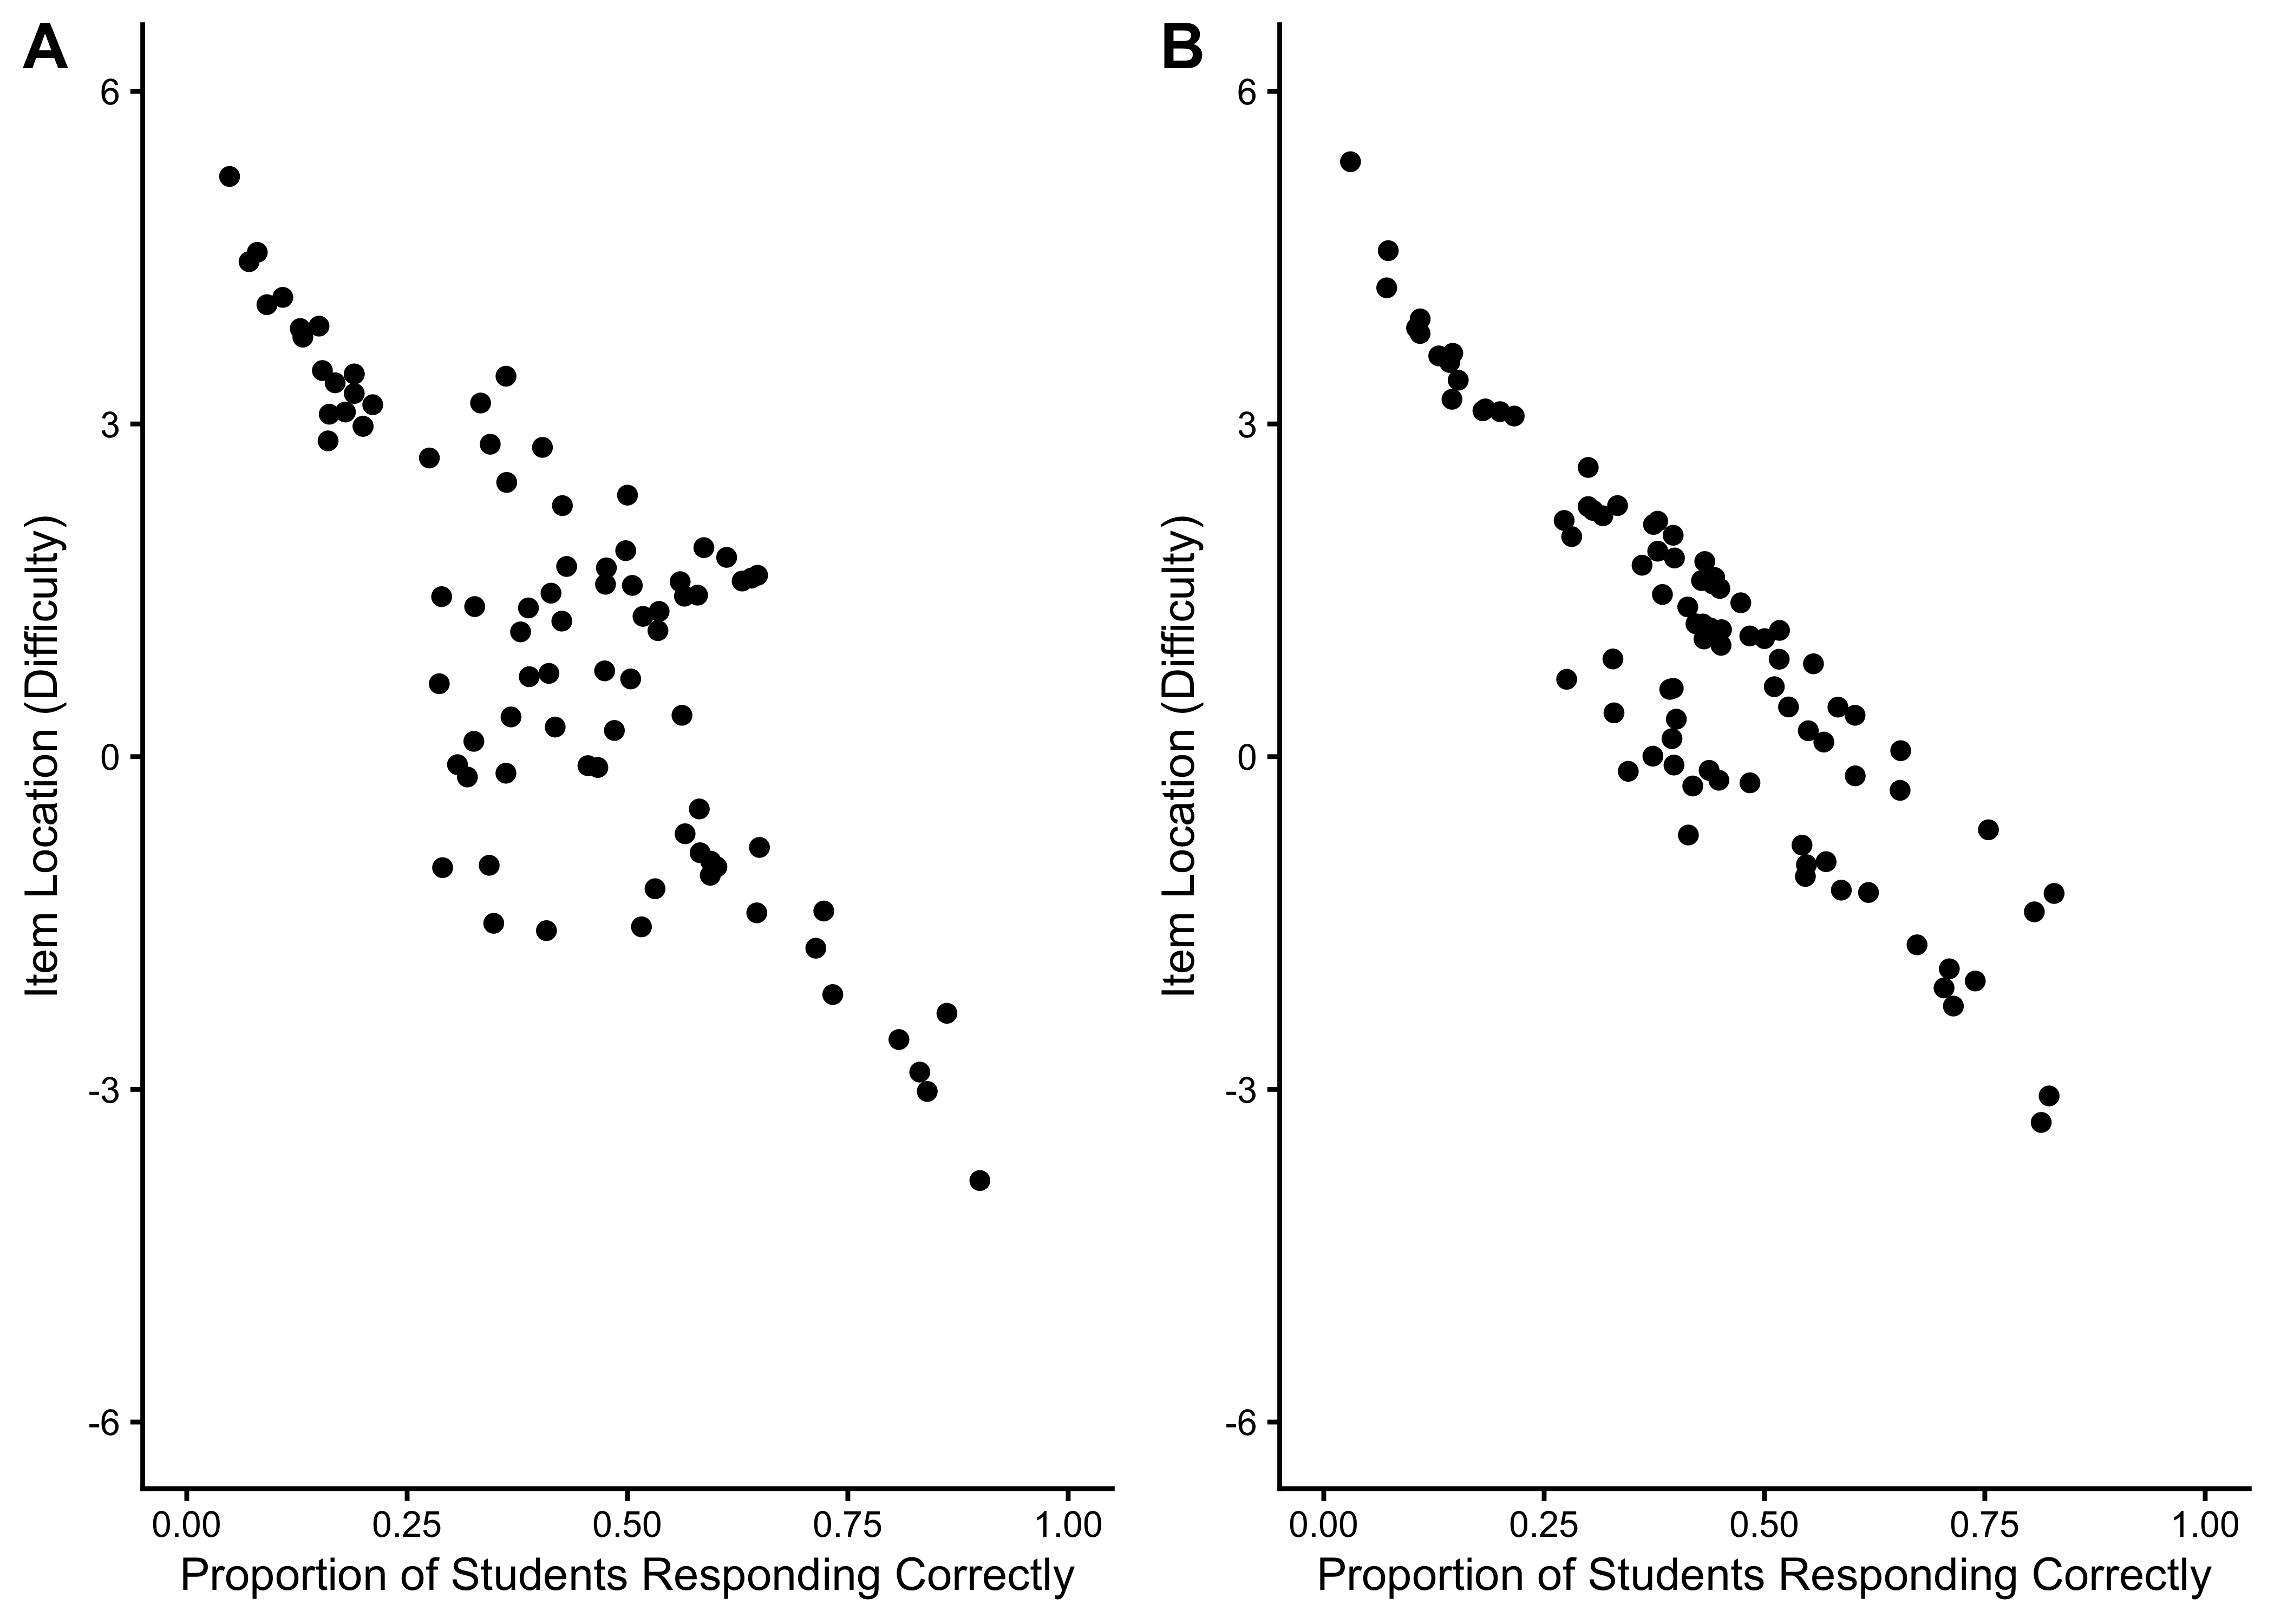
22.6.2.1 Item Location Estimates
22.6.2.2 Item Fit Statistics
| A | B | C | D | Total | A | B | C | D | Total | |
|---|---|---|---|---|---|---|---|---|---|---|
| Outfit MSE | ||||||||||
| A | 67 | 0 | 0 | 0 | 67 | 70 | 0 | 0 | 0 | 70 |
| B | 10 | 0 | 0 | 0 | 10 | 4 | 0 | 0 | 0 | 4 |
| C | 5 | 0 | 0 | 0 | 5 | 9 | 0 | 0 | 0 | 9 |
| D | 5 | 0 | 0 | 0 | 5 | 3 | 0 | 2 | 0 | 5 |
| Total | 87 | 0 | 0 | 0 | 87 | 86 | 0 | 2 | 0 | 88 |
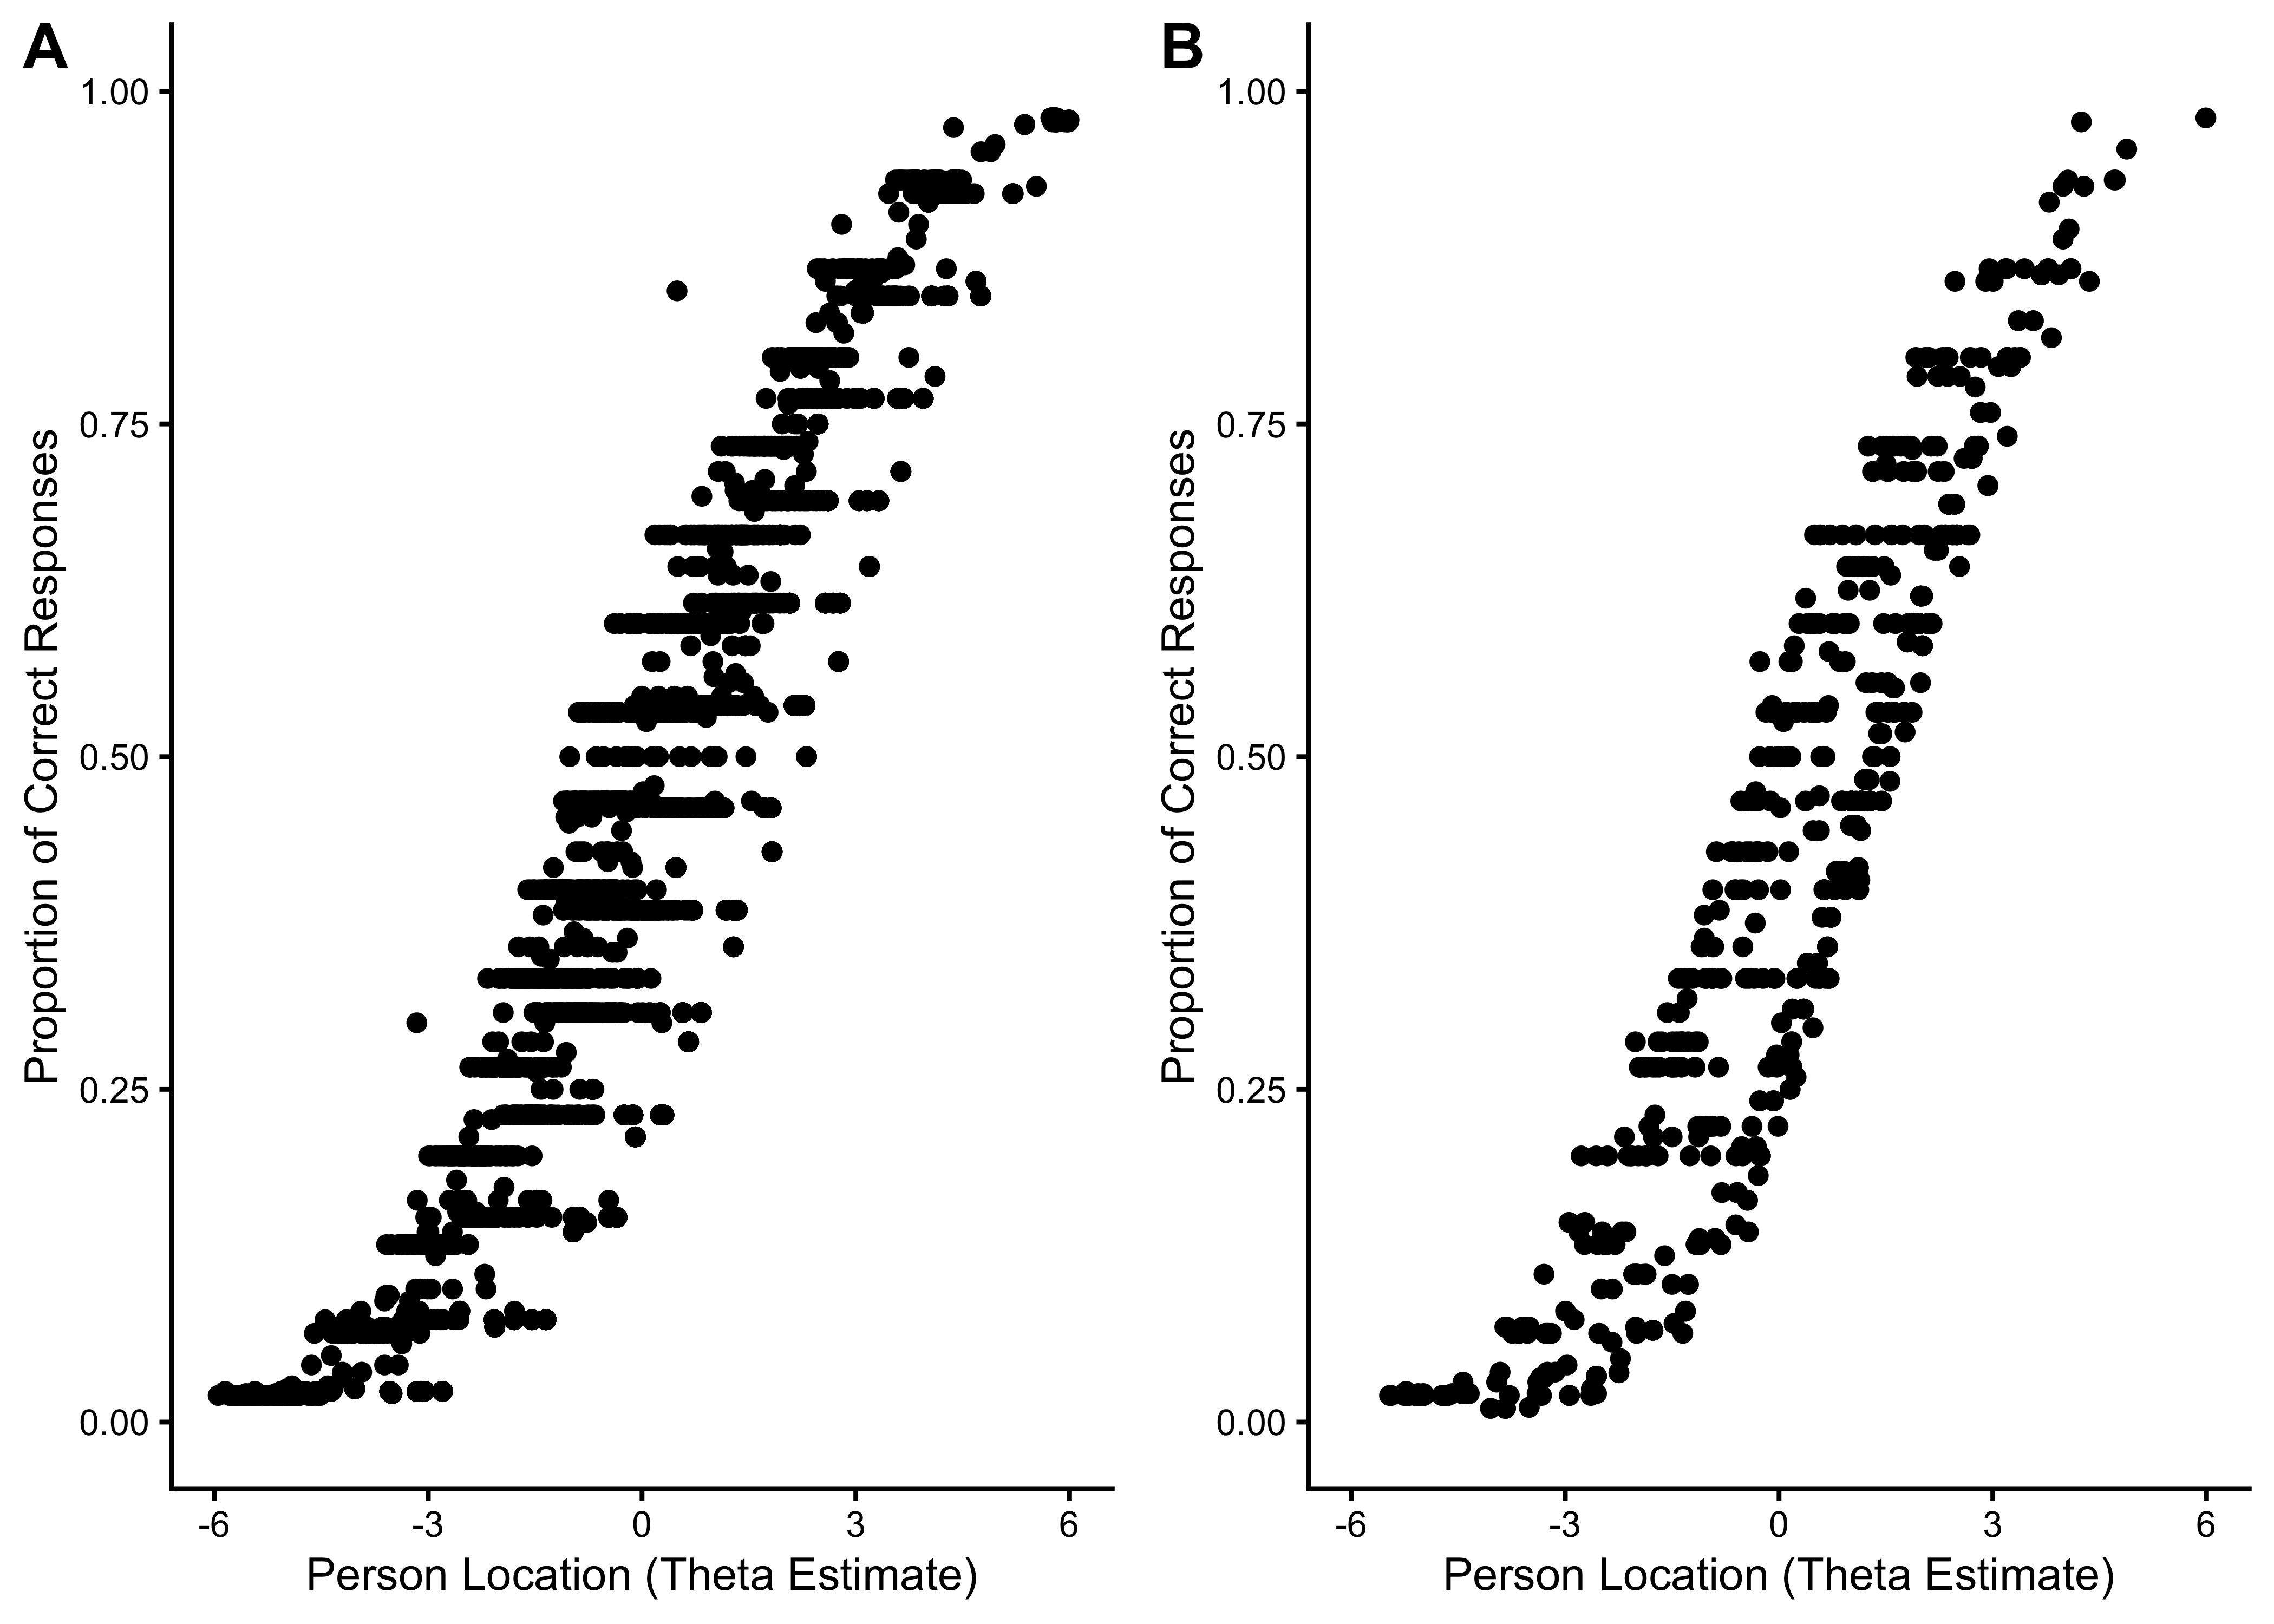
22.6.2.3 Person Location Estimates
22.6.2.4 Person Fit Statistics
| A | B | C | D | Total | A | B | C | D | Total | |
|---|---|---|---|---|---|---|---|---|---|---|
| Outfit MSE | ||||||||||
| A | 1,846 | 0 | 9 | 2 | 1,857 | 438 | 0 | 1 | 0 | 439 |
| B | 319 | 364 | 0 | 0 | 683 | 67 | 102 | 0 | 0 | 169 |
| C | 70 | 0 | 14 | 1 | 85 | 24 | 0 | 6 | 0 | 30 |
| D | 78 | 0 | 28 | 7 | 113 | 15 | 0 | 8 | 0 | 23 |
| Total | 2,313 | 364 | 51 | 10 | 2,738 | 544 | 102 | 15 | 0 | 661 |
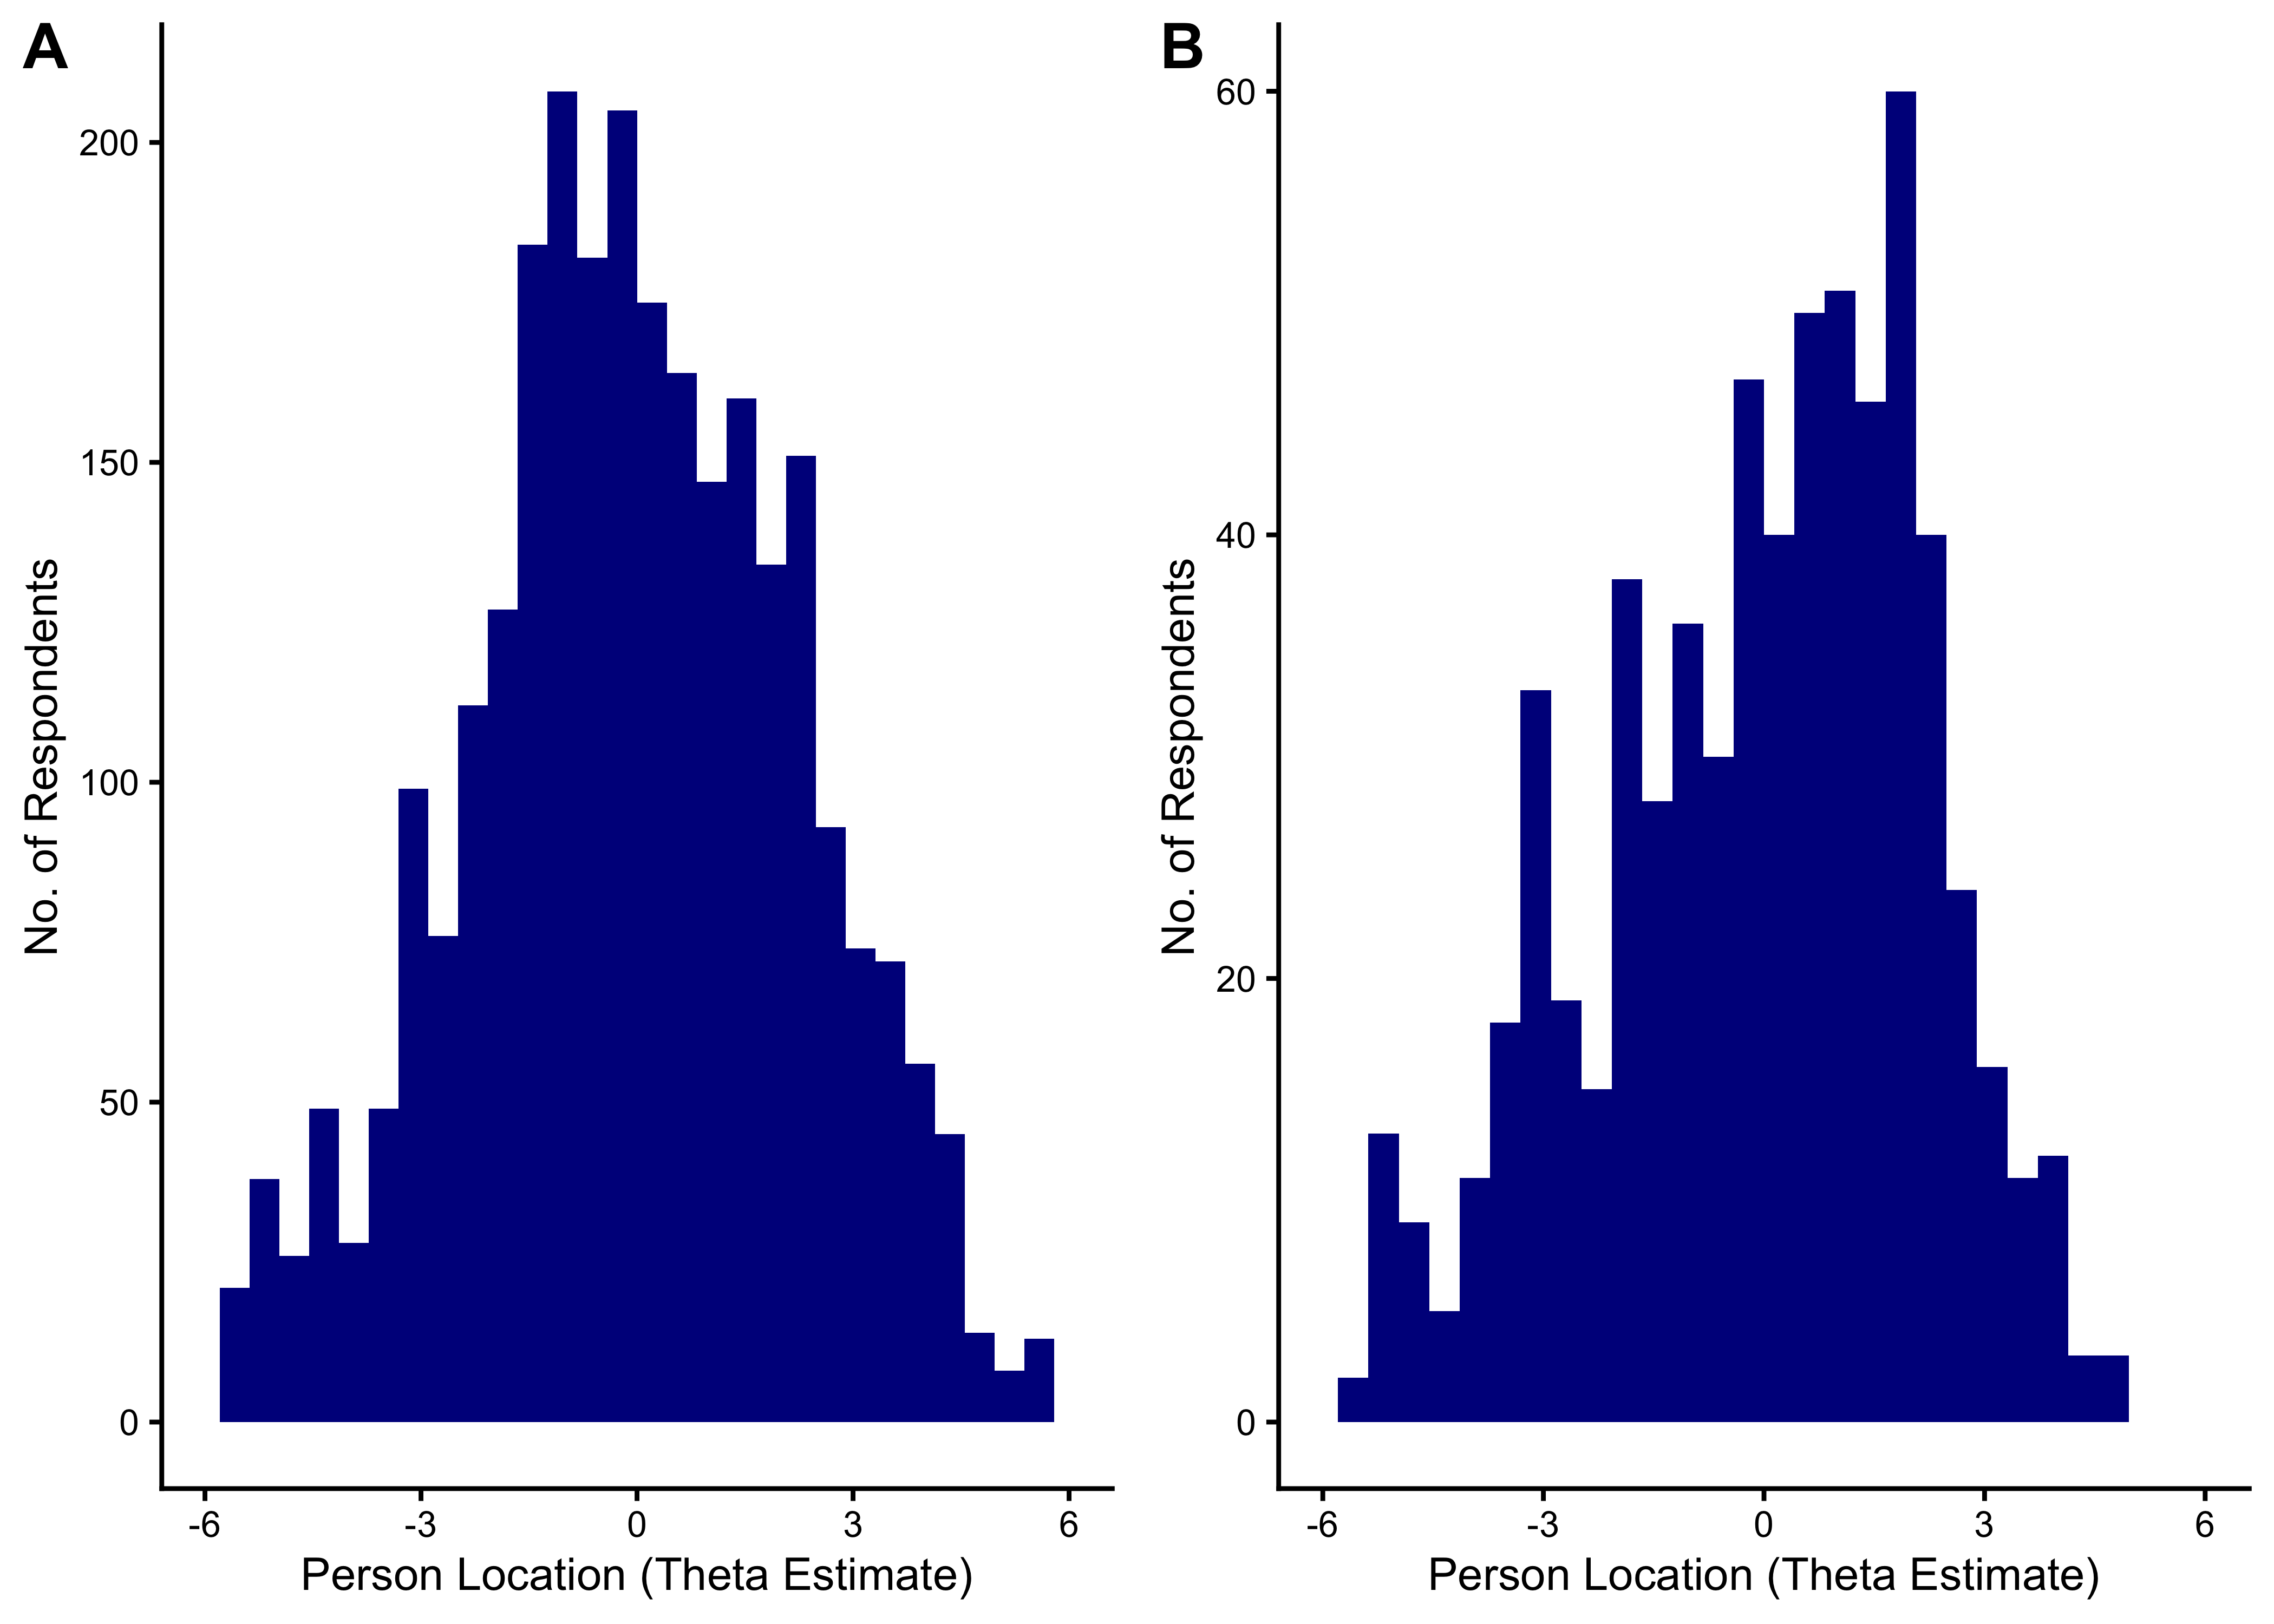
22.6.2.5 Distribution of Theta Estimates
22.6.2.6 Wright Maps
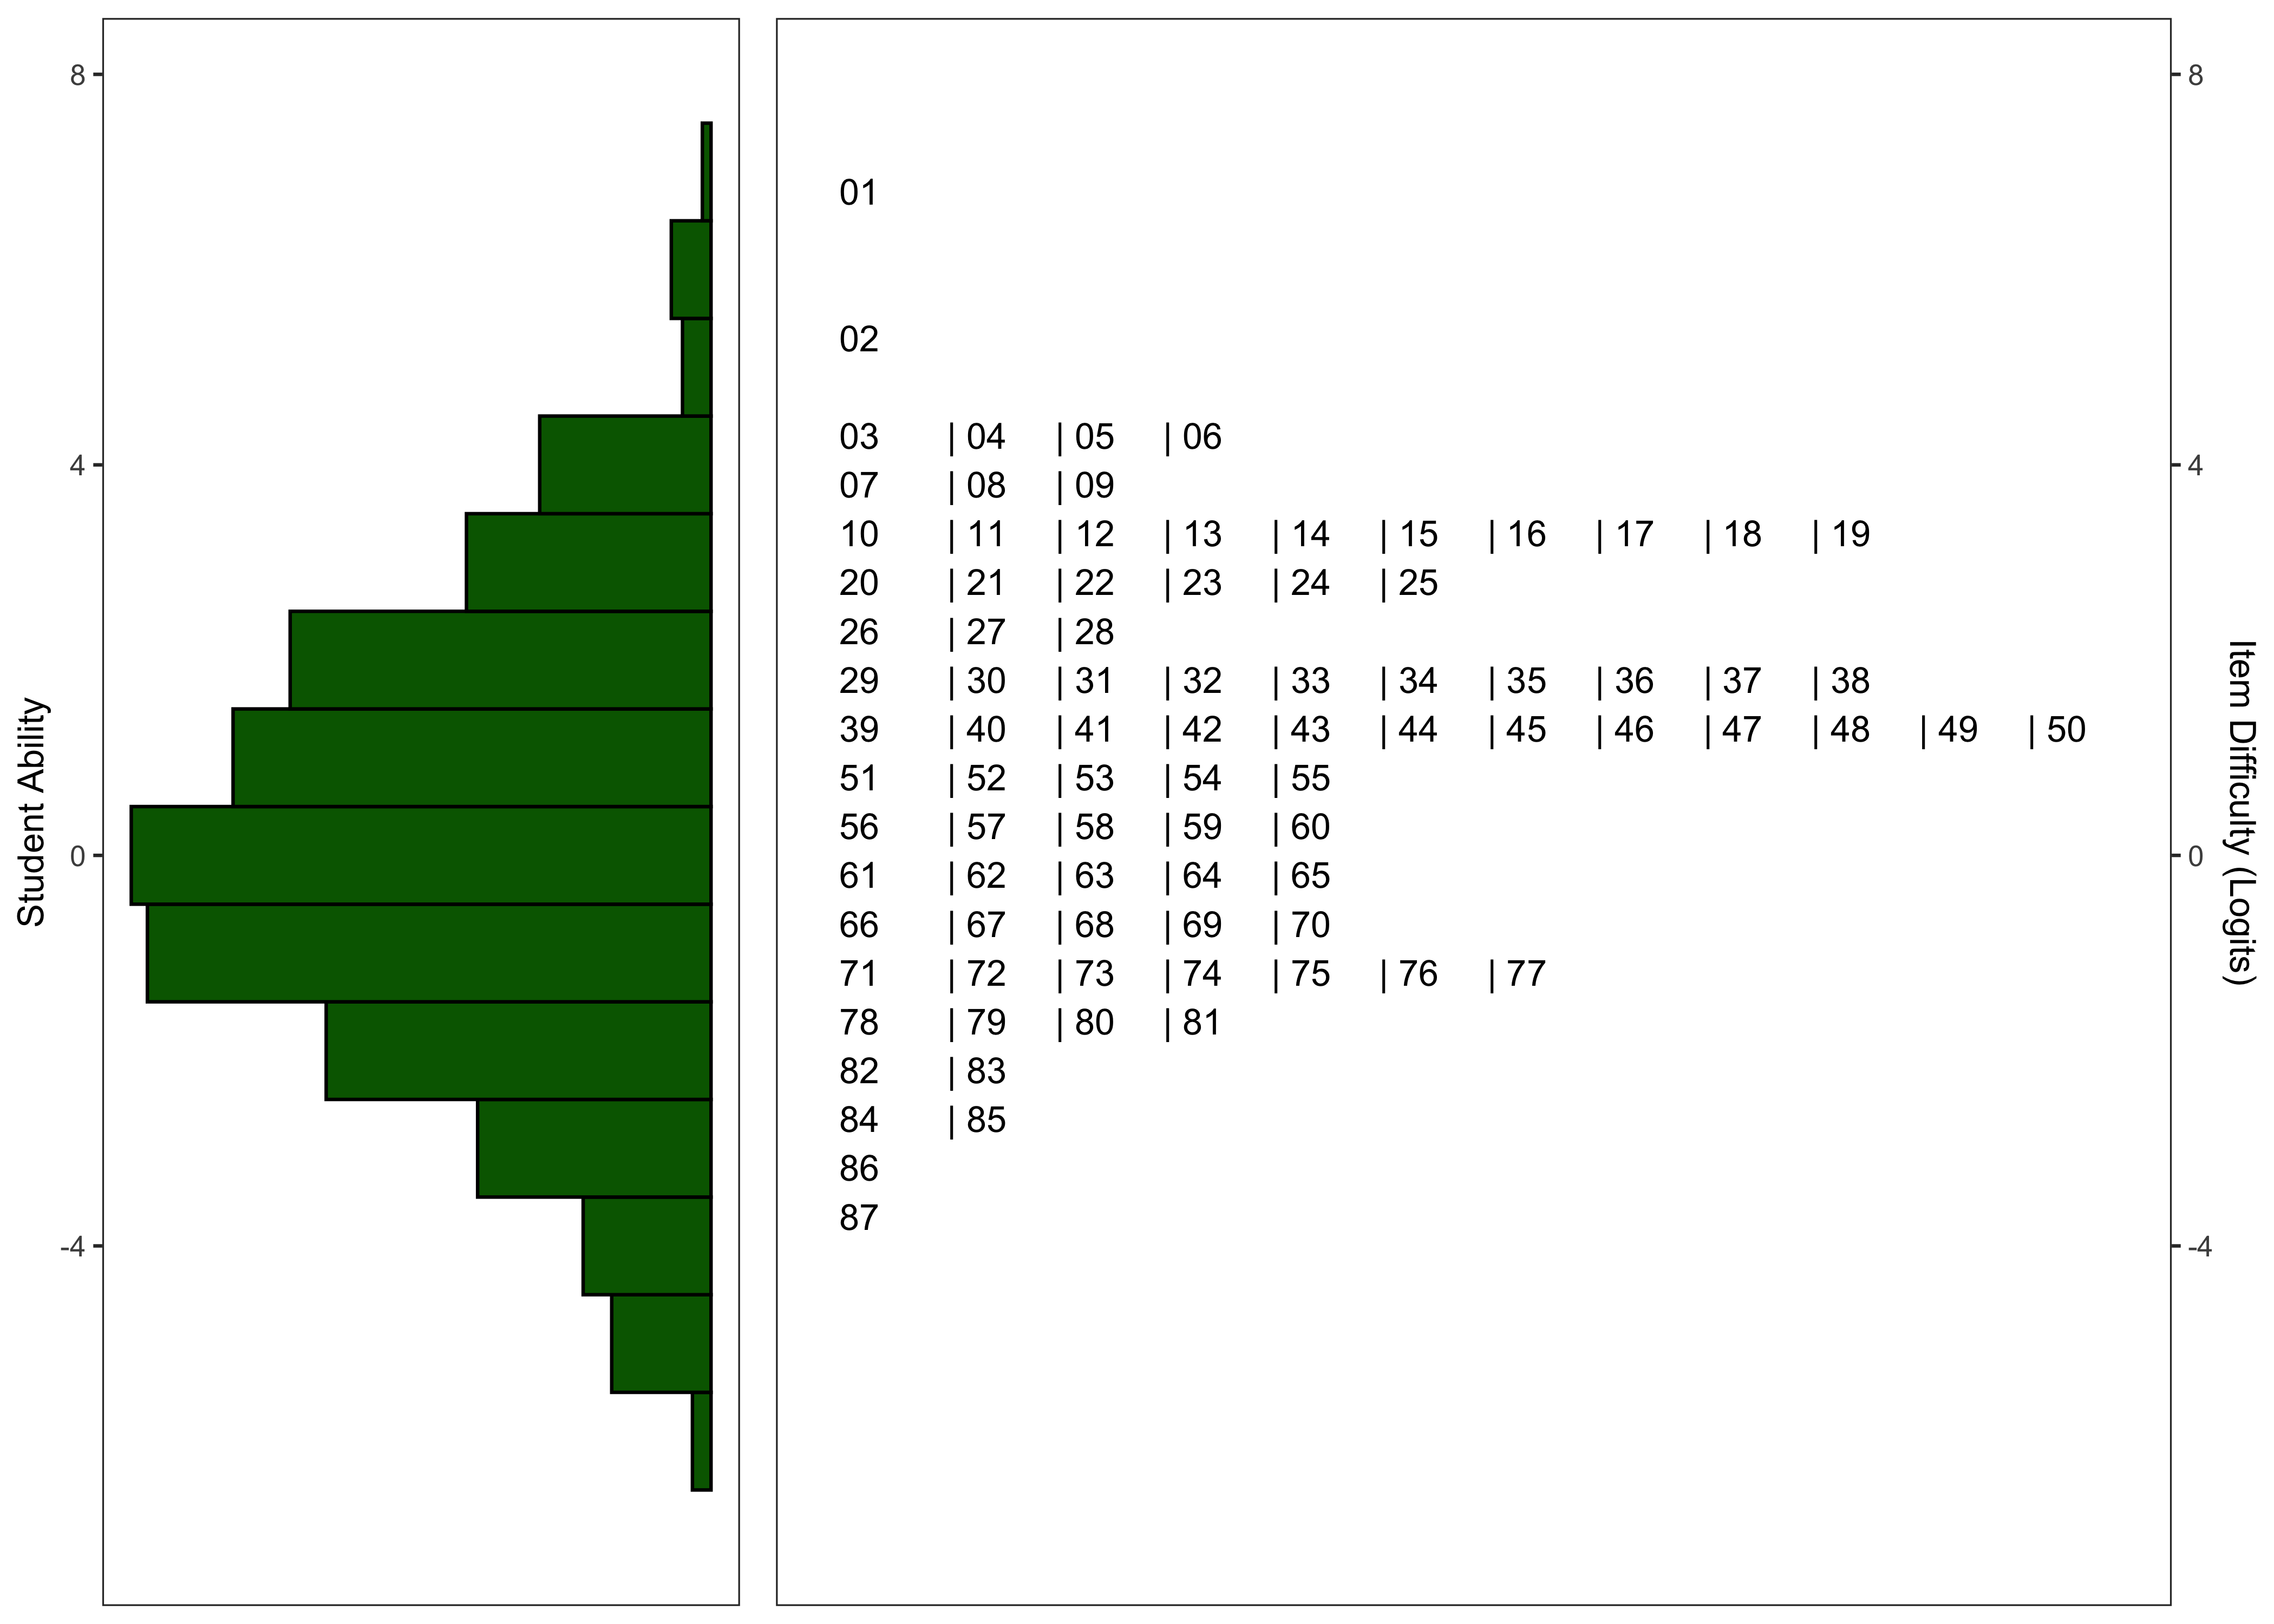
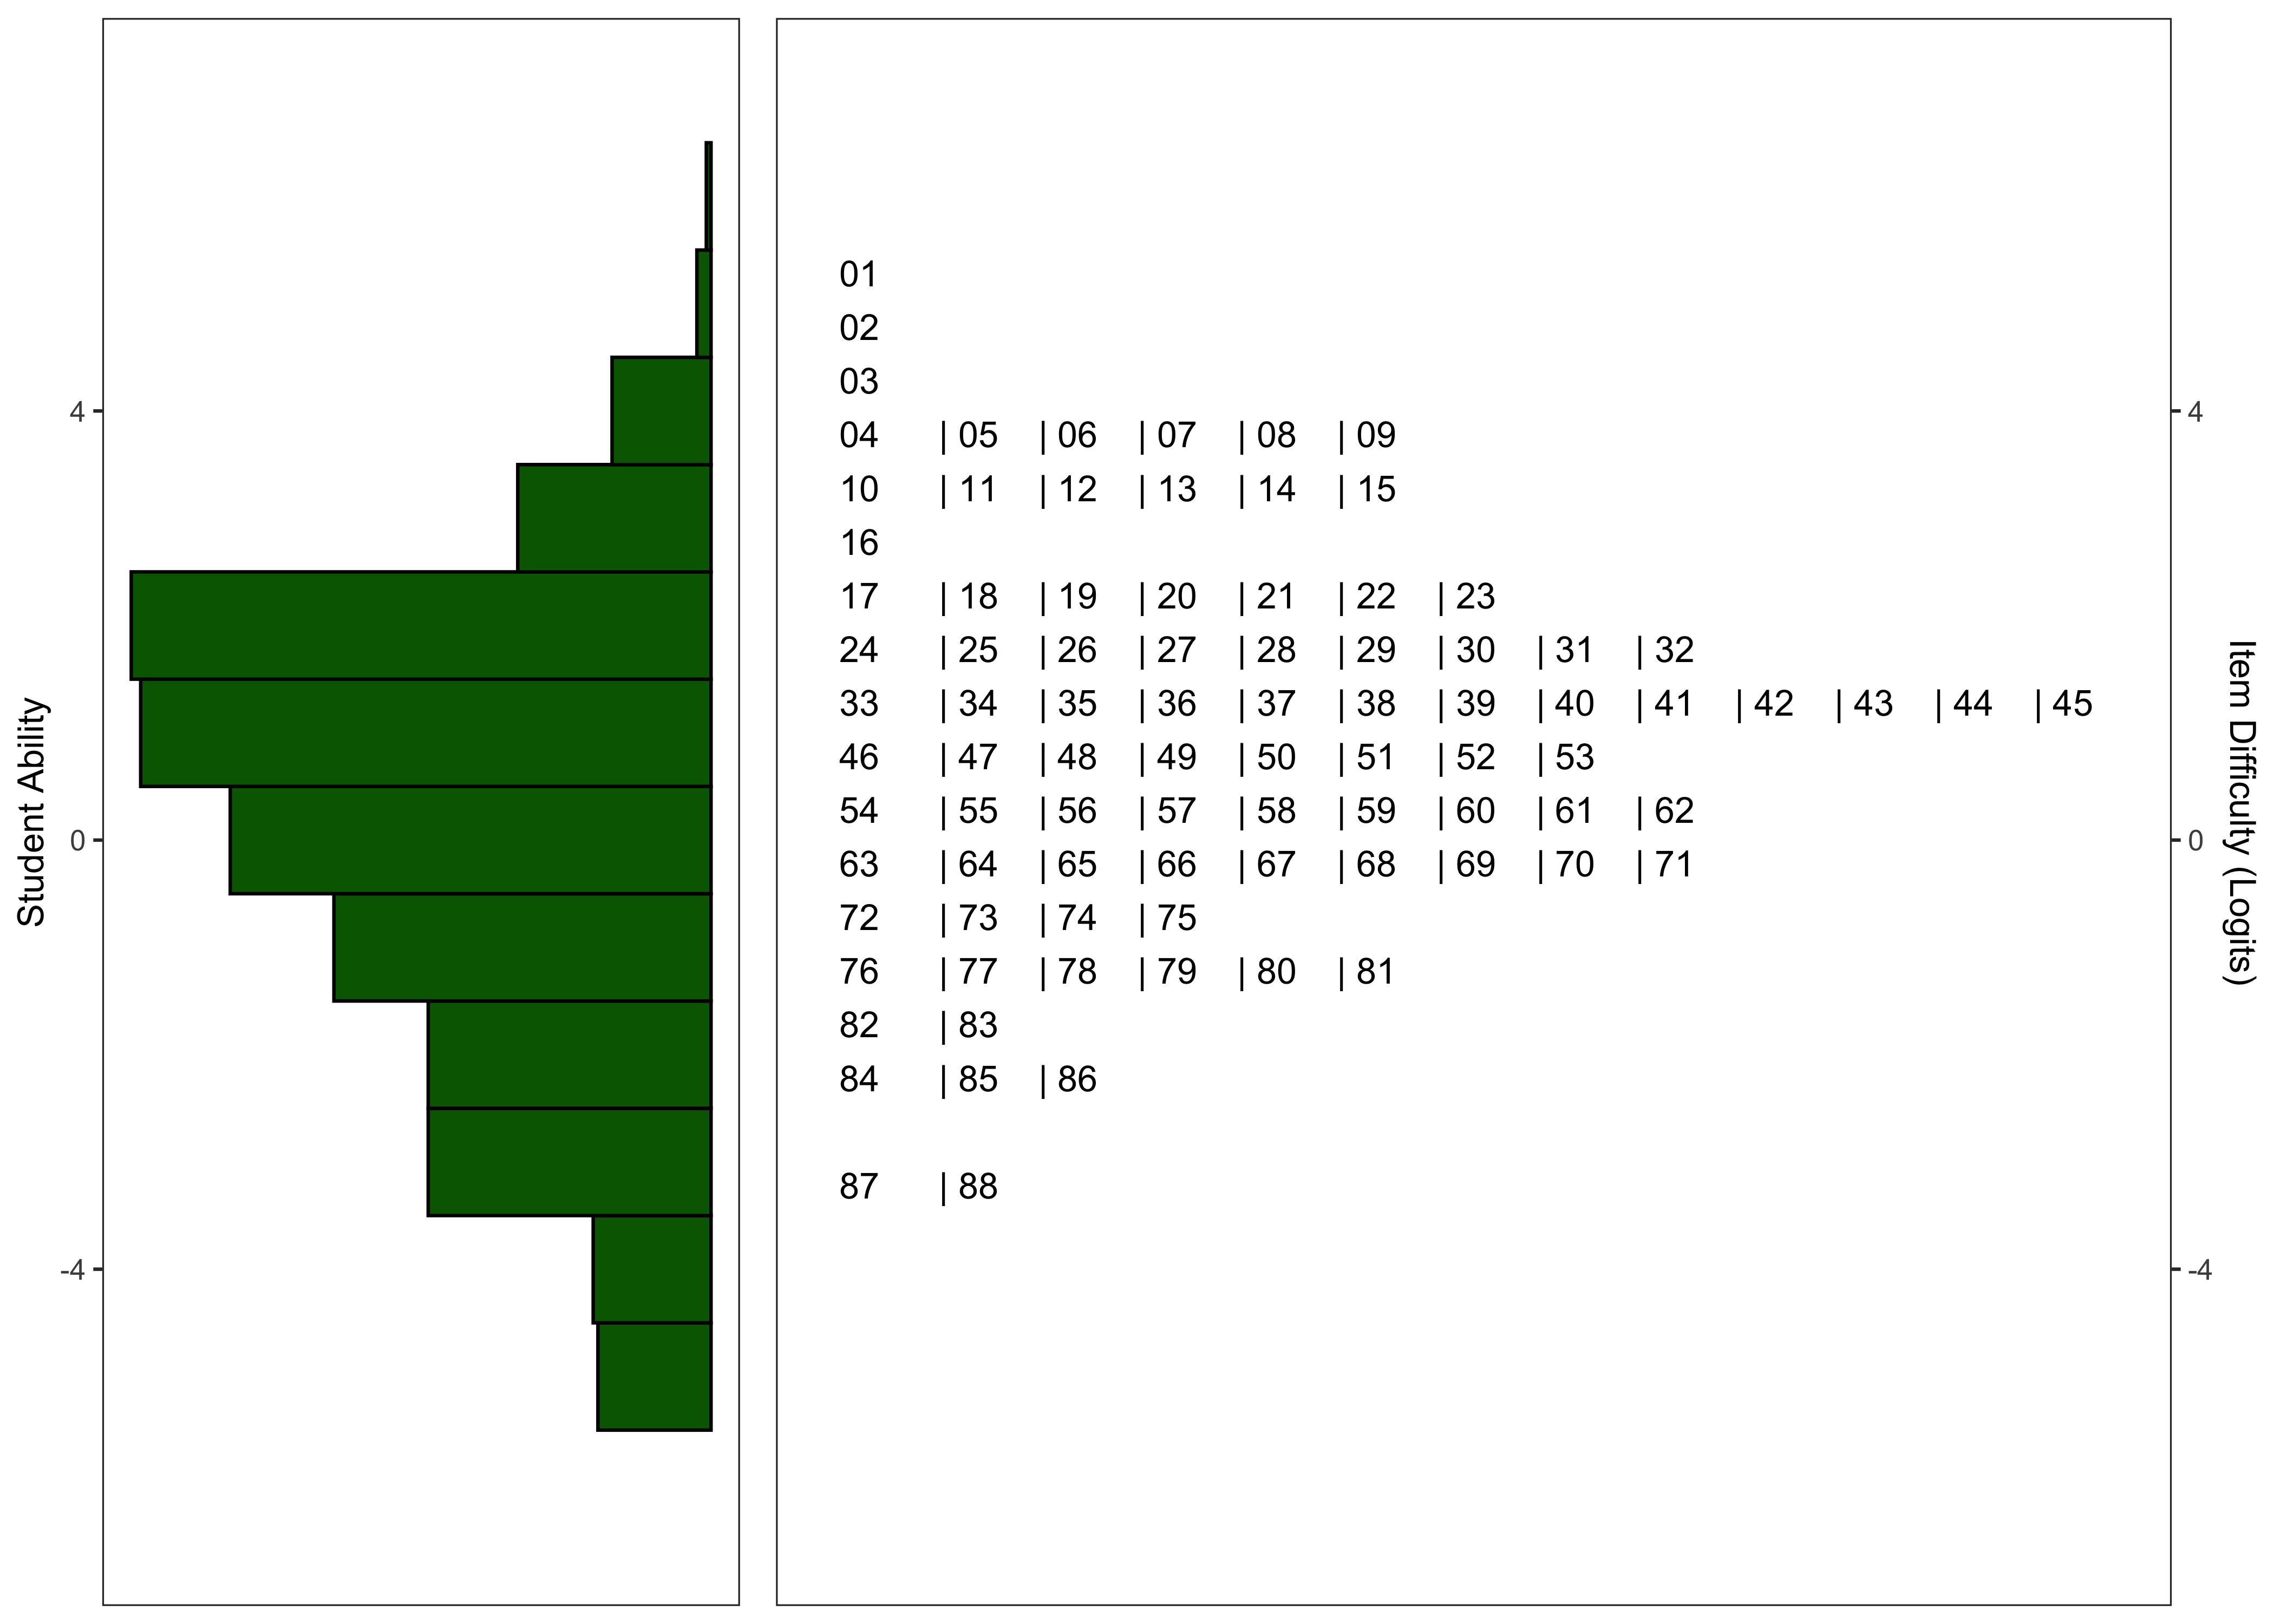
22.6.2.7 Model Summary
| Characteristic | N = 87 | N = 2,738 | N = 88 | N = 661 |
|---|---|---|---|---|
| Logit Scale Location | 1.15 (2.08) | -0.09 (-1.54, 1.66) | 0.98 (1.77) | 0.25 (-1.57, 1.76) |
| Outfit | 1.08 (0.91) | 0.69 (0.50, 0.89) | 1.10 (0.59) | 0.70 (0.49, 0.97) |
| Infit | 0.98 (0.13) | 0.84 (0.68, 0.99) | 1.02 (0.19) | 0.85 (0.67, 1.01) |
| Reliability of Separation | 0.8937 | 0.8560 | 0.8871 | 0.8307 |
22.6.2.7.1 Final Number of Items
Following the exclusion of items with point-biserial correlations < .20 and items with poor fit statistics, the final versions of the task contain 87 and 88 for the English and Spanish task, respectively.
22.7 Criterion Validity Evidence
22.7.1 Sample
| Characteristic |
English
|
Spanish
|
|---|---|---|
| G2 N = 212 |
G2 N = 221 |
|
| Timepoint | ||
| Spring 2024 | 212 (100%) | |
| Race | ||
| American/Alaskan Native | 2 (0.9%) | 4 (1.8%) |
| Asian | 15 (7.1%) | 9 (4.1%) |
| Black/African American | 27 (13%) | 1 (0.5%) |
| Not reported | 34 (16%) | 50 (23%) |
| Other | 45 (21%) | 73 (33%) |
| White | 89 (42%) | 84 (38%) |
| Ethnicity | ||
| Hispanic/Latin(o/a) | 102 (48%) | 202 (92%) |
| Intentional nonreport | 3 (1.4%) | |
| Not Hispanic/Latin(o/a) | 106 (50%) | 18 (8.2%) |
| Unknown | 1 | 1 |
| Gender | ||
| Female | 93 (44%) | 110 (50%) |
| Male | 119 (56%) | 110 (50%) |
| Home Language | ||
| English | 148 (70%) | 54 (24%) |
| Spanish | 38 (18%) | 159 (72%) |
| Other | 24 (11%) | 8 (3.6%) |
| Unknown | 2 | |
| English Proficiency Label | ||
| (Re-)Classified Proficient | 17 (8.1%) | 41 (19%) |
| English Learner | 42 (20%) | 136 (62%) |
| English-only | 152 (72%) | 42 (19%) |
| Unknown | 1 | 2 |
| Ever IEP/504 | 20 (13%) | 16 (8.9%) |
| Unknown | 54 | 41 |
| Spring 2025 | 221 (100%) | |
| Unknown | 1 |
English Spelling was correlated with the Spelling subtest from the Woodcock-Johnson IV (WJ IV ACH) test (Schrank, McGrew, and Mather 2014). Spanish Spelling results are forthcoming.
| Grade | n | r [CI] | n | r [CI] | n | r [CI] |
|---|---|---|---|---|---|---|
| G2 | 212 | 0.80 [0.75, 0.84] | 42 | 0.79 [0.64, 0.88] | 220 | 0.72 [0.65, 0.78] |