| Characteristic |
English
|
Spanish
|
||||
|---|---|---|---|---|---|---|
| K N = 2,127 |
G1 N = 2,805 |
G2 N = 2,887 |
K N = 1,164 |
G1 N = 1,270 |
G2 N = 1,013 |
|
| Timepoint | ||||||
| Spring 2023 | 0 (0%) | 0 (0%) | 0 (0%) | 621 (53%) | 630 (50%) | 0 (0%) |
| Fall 2023 | 611 (29%) | 668 (24%) | 703 (24%) | 0 (0%) | 0 (0%) | 345 (34%) |
| Winter 2024 | 0 (0%) | 0 (0%) | 0 (0%) | 0 (0%) | 0 (0%) | 264 (26%) |
| Fall 2024 | 1,516 (71%) | 2,137 (76%) | 2,184 (76%) | 543 (47%) | 640 (50%) | 404 (40%) |
| Administration Format | ||||||
| CAT | 1,516 (71%) | 2,137 (76%) | 2,184 (76%) | |||
| Forms | 611 (29%) | 668 (24%) | 703 (24%) | 621 (100%) | 630 (100%) | 609 (100%) |
| Race | ||||||
| American/Alaskan Native | 71 (3.6%) | 97 (3.7%) | 64 (2.4%) | 40 (3.5%) | 45 (3.6%) | 13 (1.3%) |
| Asian | 155 (7.8%) | 223 (8.6%) | 197 (7.4%) | 20 (1.8%) | 32 (2.6%) | 24 (2.4%) |
| Black/African American | 208 (10%) | 283 (11%) | 305 (11%) | 11 (1.0%) | 19 (1.5%) | 11 (1.1%) |
| Not reported | 196 (9.9%) | 263 (10%) | 246 (9.2%) | 484 (42%) | 552 (45%) | 465 (47%) |
| Other | 442 (22%) | 343 (13%) | 350 (13%) | 230 (20%) | 151 (12%) | 67 (6.7%) |
| White | 917 (46%) | 1,395 (54%) | 1,503 (56%) | 355 (31%) | 438 (35%) | 419 (42%) |
| Unknown | 138 | 201 | 222 | 24 | 33 | 14 |
| Ethnicity | ||||||
| Hispanic/Latin(o/a) | 1,245 (68%) | 1,806 (69%) | 1,851 (70%) | 979 (96%) | 1,150 (97%) | 926 (94%) |
| Intentional nonreport | 16 (0.9%) | 8 (0.3%) | 5 (0.2%) | 3 (0.3%) | 3 (0.3%) | 2 (0.2%) |
| Not Hispanic/Latin(o/a) | 573 (31%) | 787 (30%) | 783 (30%) | 34 (3.3%) | 37 (3.1%) | 55 (5.6%) |
| Unknown | 293 | 204 | 248 | 148 | 80 | 30 |
| Gender | ||||||
| Female | 946 (51%) | 1,290 (50%) | 1,303 (50%) | 537 (53%) | 662 (57%) | 508 (51%) |
| Male | 920 (49%) | 1,307 (50%) | 1,322 (50%) | 477 (47%) | 501 (43%) | 481 (49%) |
| Non-binary | 0 (0%) | 0 (0%) | 0 (0%) | 0 (0%) | 0 (0%) | 1 (0.1%) |
| Unknown | 261 | 208 | 262 | 150 | 107 | 23 |
| Home Language | ||||||
| English | 1,295 (70%) | 1,633 (68%) | 1,633 (66%) | 114 (10%) | 126 (10%) | 101 (10%) |
| Spanish | 471 (25%) | 672 (28%) | 740 (30%) | 1,009 (89%) | 1,100 (89%) | 858 (89%) |
| Other | 82 (4.4%) | 87 (3.6%) | 110 (4.4%) | 16 (1.4%) | 5 (0.4%) | 9 (0.9%) |
| Unknown | 279 | 413 | 404 | 25 | 39 | 45 |
| English Proficiency Label | ||||||
| (Re-)Classified Proficient | 60 (3.5%) | 111 (4.8%) | 258 (11%) | 74 (7.6%) | 96 (8.6%) | 121 (13%) |
| English Learner | 462 (27%) | 651 (28%) | 593 (24%) | 813 (84%) | 912 (82%) | 718 (77%) |
| English-only | 1,179 (69%) | 1,574 (67%) | 1,606 (65%) | 84 (8.7%) | 107 (9.6%) | 93 (10.0%) |
| Unknown | 426 | 469 | 430 | 193 | 155 | 81 |
| Ever IEP/504 | 118 (8.1%) | 201 (9.8%) | 212 (10%) | 74 (10%) | 70 (9.3%) | 76 (11%) |
| Unknown | 665 | 752 | 818 | 452 | 515 | 330 |
| Unknown | 543 | 640 | 404 | |||
11 Expressive Vocabulary
11.1 Task Description
Children are shown pictures and are asked to name them.
11.2 Construct
The Expressive Vocabulary task measures the construct of semantic knowledge. Students are prompted to name images, thereby measuring the ability to accurately label nouns and verbs.
11.3 Item Development
The Multitudes development process involved developing parallel measures in English and Spanish when possible. To be able to develop a linguistically and culturally appropriate measure scored conceptually, we needed to select a list of words that were relevant for the population being studied, with comparable levels of difficulty, and easily represented with an image.
For the selection of the words being targeted with our measure, we first reviewed reading curricula commonly used in California, specifically, and in the United States more broadly, in addition to other literacy materials sourced from Chile, Mexico, and Panama. To extend the list of selected words, we used Age of Acquisition (AoA) databases for English (Brysbaert and Biemiller 2017) and Spanish (Alonso, Fernández, and Díez 2015; Alonso, Díez, and Fernández 2016) to compile a comprehensive list with somewhat comparable AoA in both languages. The AoA was used as a proxy of difficulty, hypothesizing that words acquired earlier in development were more likely to yield easier items. In addition to AoA information, we used Clearpond (Marian et al. 2012) to retrieve information on the word’s frequency, orthographic and phonological length, and neighborhood frequency.
We used iStock to choose the real pictures of the selected words. The chosen pictures underwent a rigorous selection process to meet specific criteria:
- Easily Recognizable. Emphasis was placed on selecting images that could be easily identified.
- Minimal Construct Irrelevant Features. Preference was given to pictures with a clean and unobtrusive background, and a white background was opted for whenever possible.
- Removal of Irrelevant Information. Unnecessary elements, such as a leaf in a pear or surrounding mountains, were eliminated through cropping, focusing solely on the essential components of the image.
- Culturally Representative. Images that were representative of a culturally diverse population. The final pool of images was reviewed by the Justice, Equity, Diversity, and Inclusion committee, and any images that were identified as not representative of the target word or that had potential concerns were deliberately excluded from the final pool.
11.3.1 Dialectal considerations.
- English. The researchers listed all acceptable responses, and an additional online search was conducted to find other regional terms for specific items in English.
- Spanish. A group of six Spanish-English bilingual research assistants was shown the images and requested to label them. To avoid penalizing the use of regional terms, we asked research assistants from different countries or regions (including Chile, Colombia, three different states in Mexico, and Venezuela) to list all the different terms known to them to label said pictures. An additional search was conducted to find other regional terms for both English and Spanish.
Additionally, a blank box was available for examiners to annotate other possible acceptable responses given by the participating children during piloting. We then reviewed all of those responses and decided which ones should be added to the correct response list for each item.
11.4 Scoring
11.4.1 English
A list of accepted terms for English was provided. The assessment uses a dichotomous fixed response format of 0 points for incorrect responses or non-responses and 1 point for correct ones.
11.4.2 Spanish-English Bilingual
A list of accepted words for Spanish and English is provided. The assessment was calibrated using conceptual scoring meaning a child can respond in either English or Spanish. The assessment uses a dichotomous fixed response format of 0 points for incorrect responses or non-responses and 1 point for correct ones.
11.5 Calibration Samples
11.6 Psychometric Analysis
11.6.1 Basic Item Statistics
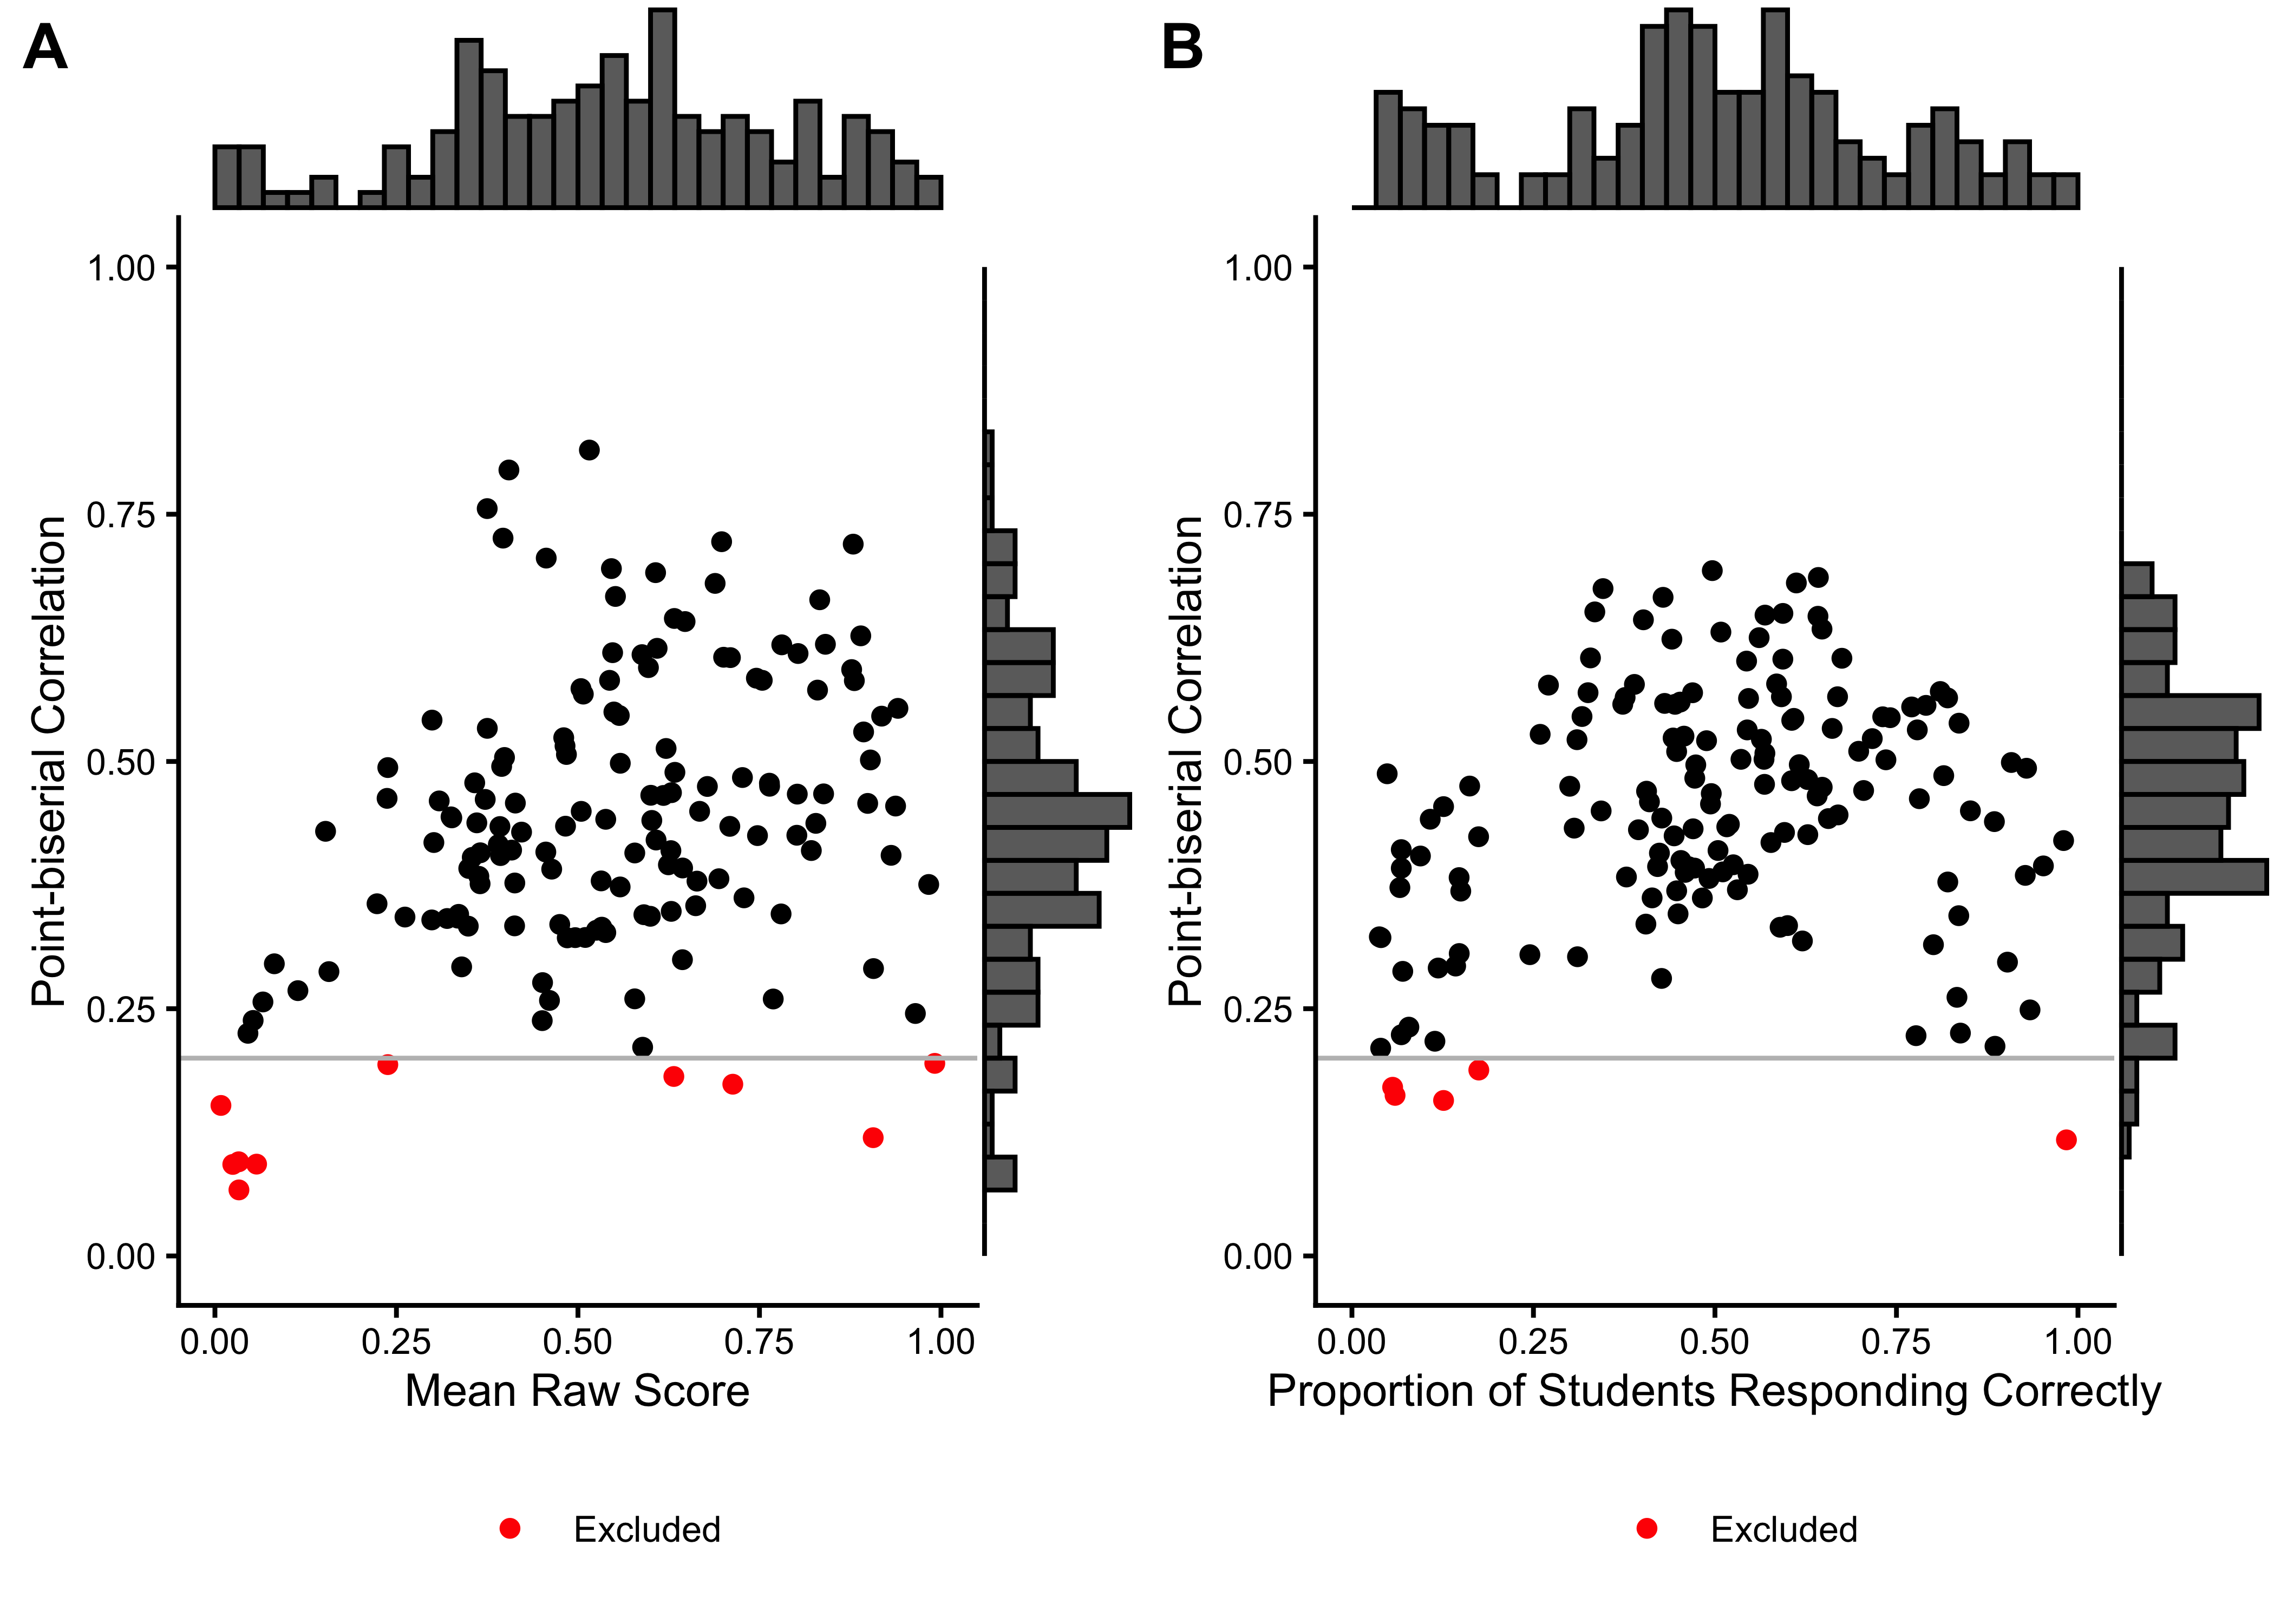
We excluded 0 items from the English task and 2 items from the Spanish task based on low response counts (n < 90). 4 items were excluded because they had no variance in the Spanish task, and 0 items in the English task. Additionally, we excluded 10 items from the English task and 5 items from the Spanish task based on low point-biserial correlations (r < 0.2). Table 11.2 summarizes the basic item characteristics, Figure 11.1 shows the relationship between point-biserial correlations and the proportion of correct responses for each item.
English
|
Spanish
|
|||
|---|---|---|---|---|
| Characteristic |
Before Excl.
|
After Excl.
|
Before Excl.
|
After Excl.
|
| N = 151 | N = 141 | N = 156 | N = 147 | |
| No. of Responses | 704 (480) | 739 (476) | 280 (253) | 292 (255) |
| Proportion Correct | 0.54 (0.23) | 0.55 (0.21) | 0.49 (0.25) | 0.50 (0.23) |
| Point-biserial Correlation | 0.44 (0.15) | 0.46 (0.13) | 0.45 (0.13) | 0.46 (0.11) |
| Excluded (n < 90) | 0 (0%) | 0 (0%) | 2 (1.3%) | 0 (0%) |
| Excluded (pbis < .2) | 10 (6.6%) | 0 (0%) | 5 (3.3%) | 0 (0%) |
| Excluded (no variation) | 0 (0%) | 0 (0%) | 4 (2.6%) | 0 (0%) |
11.6.2 Rasch Analysis
11.6.2.1 Item Location Estimates
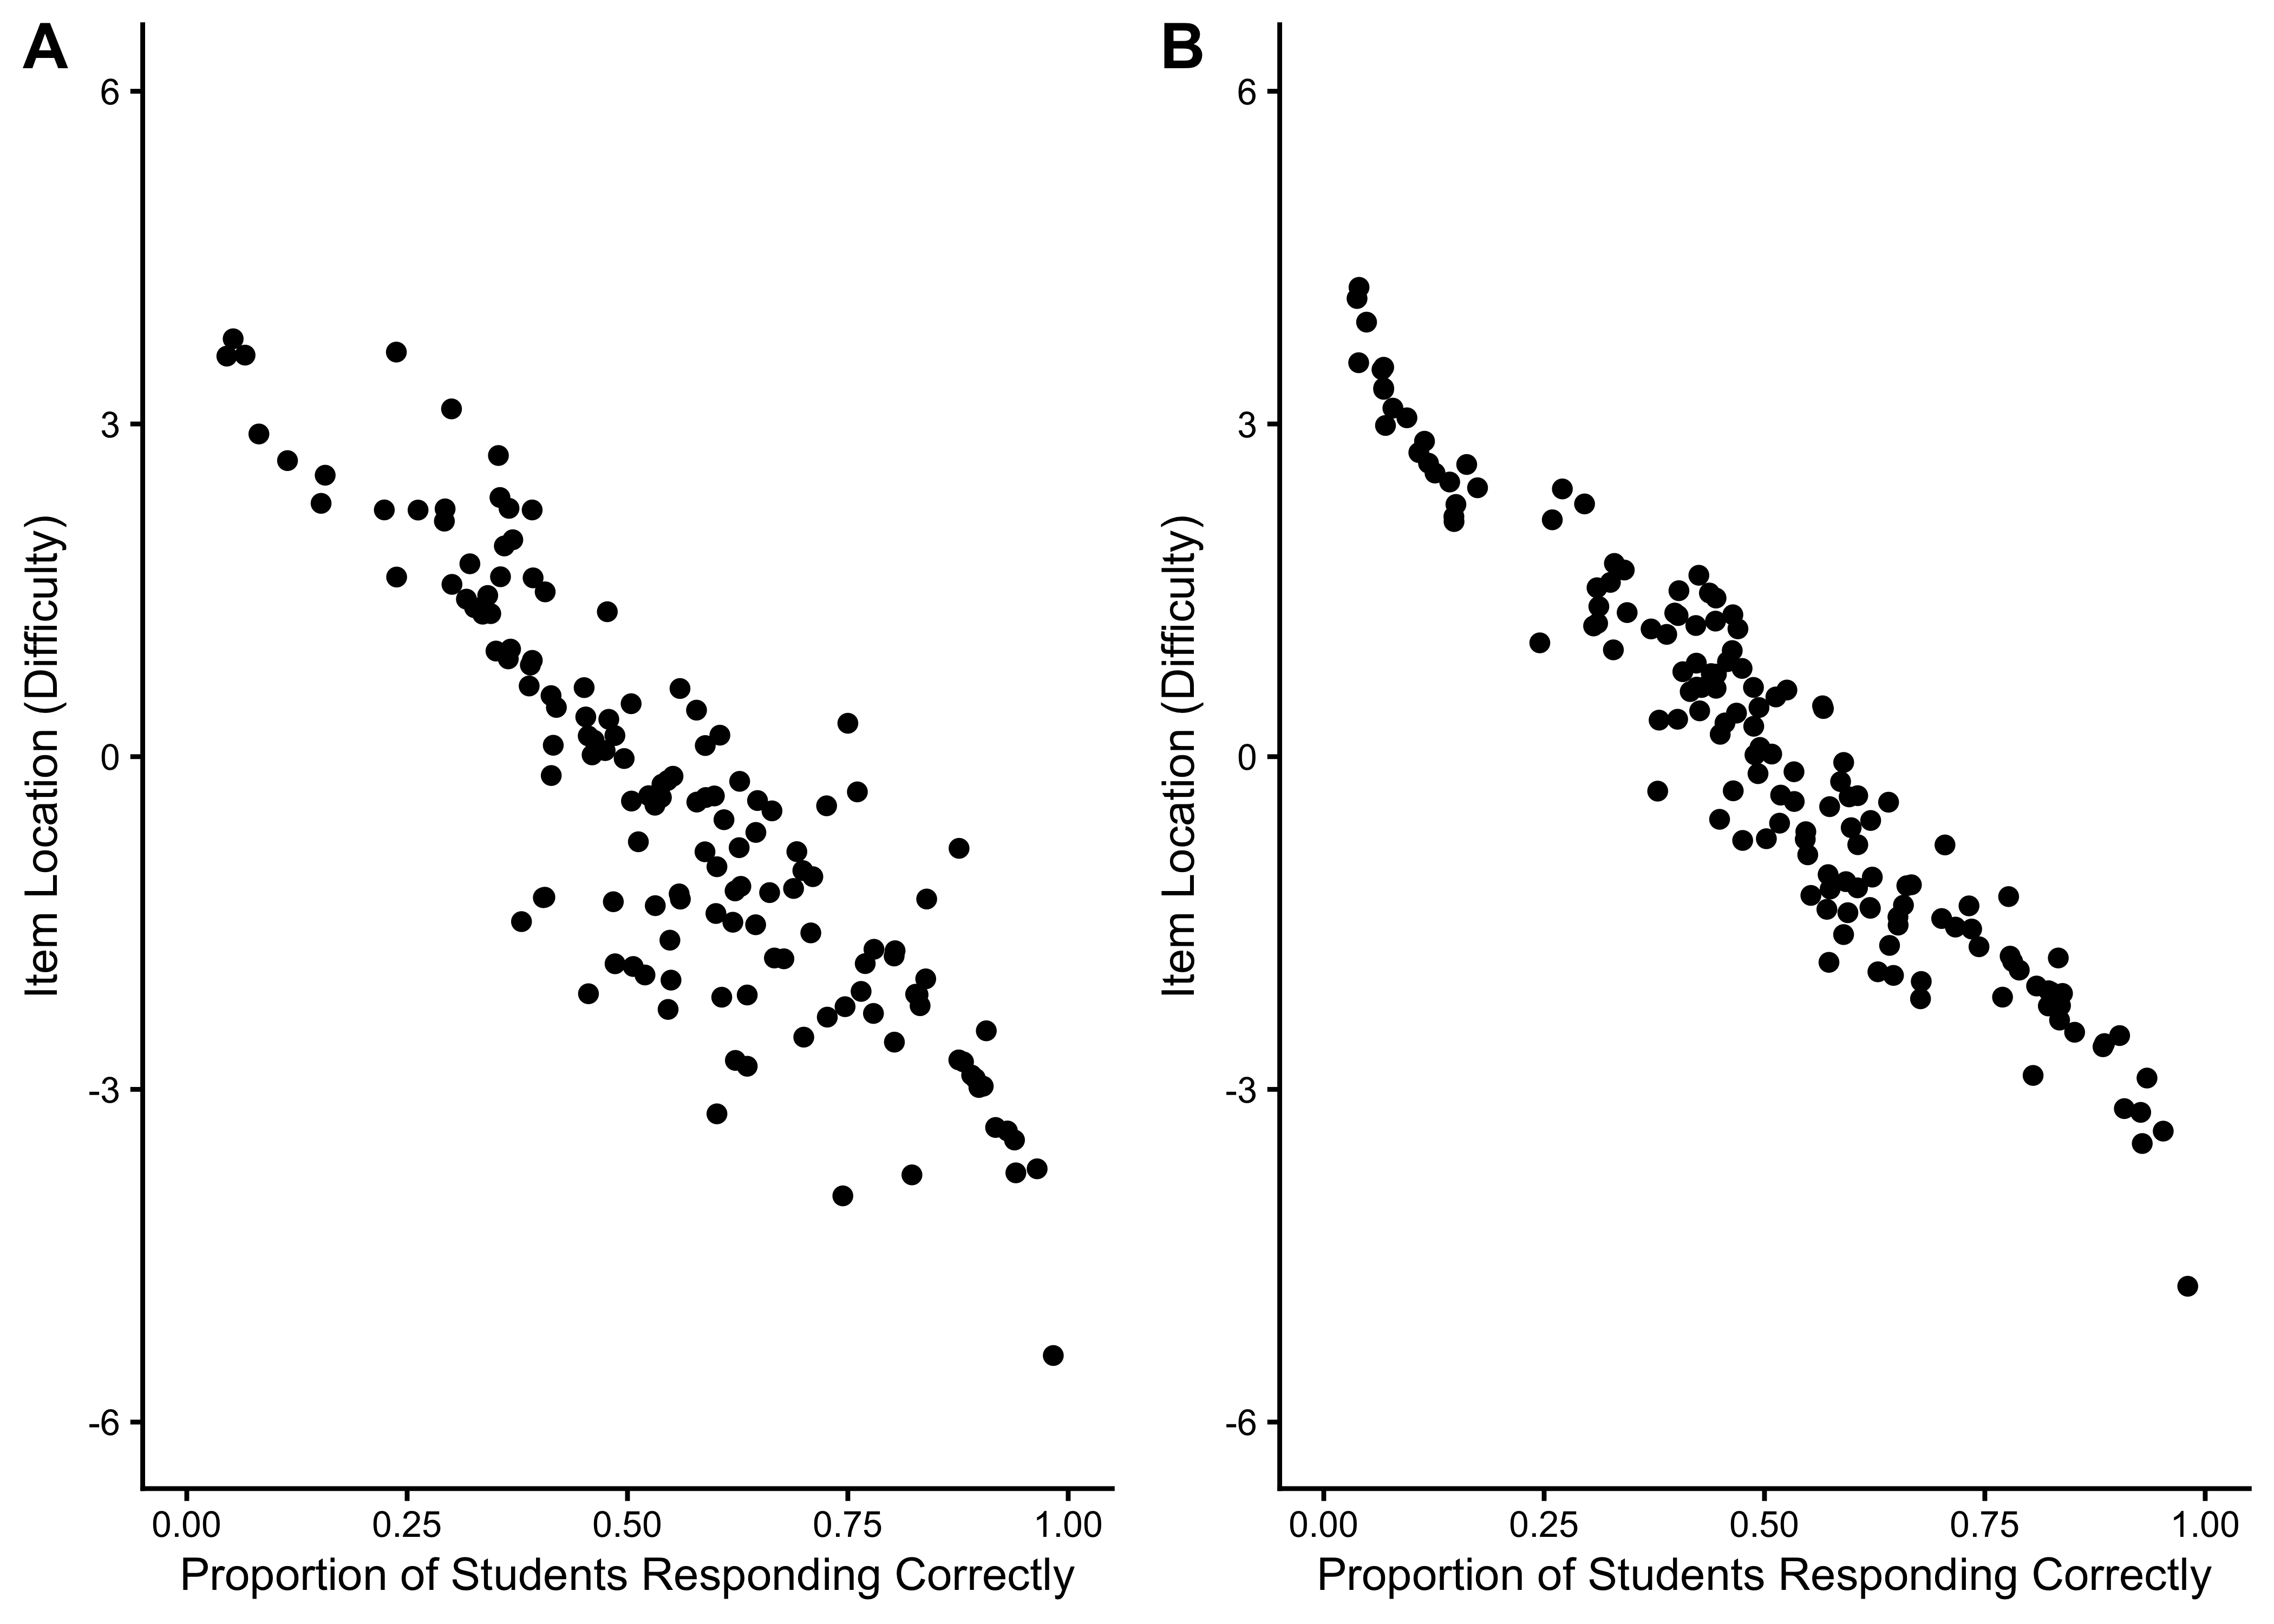
11.6.2.2 Item Fit Statistics
| A | B | C | D | Total | A | B | C | D | Total | |
|---|---|---|---|---|---|---|---|---|---|---|
| Outfit MSE | ||||||||||
| A | 131 | 0 | 0 | 0 | 131 | 139 | 0 | 0 | 0 | 139 |
| B | 3 | 0 | 0 | 0 | 3 | 4 | 0 | 0 | 0 | 4 |
| C | 5 | 0 | 0 | 0 | 5 | 4 | 0 | 0 | 0 | 4 |
| D | 2 | 0 | 0 | 0 | 2 | 0 | 0 | 0 | 0 | 0 |
| Total | 141 | 0 | 0 | 0 | 141 | 147 | 0 | 0 | 0 | 147 |
11.6.2.3 Person Location Estimates
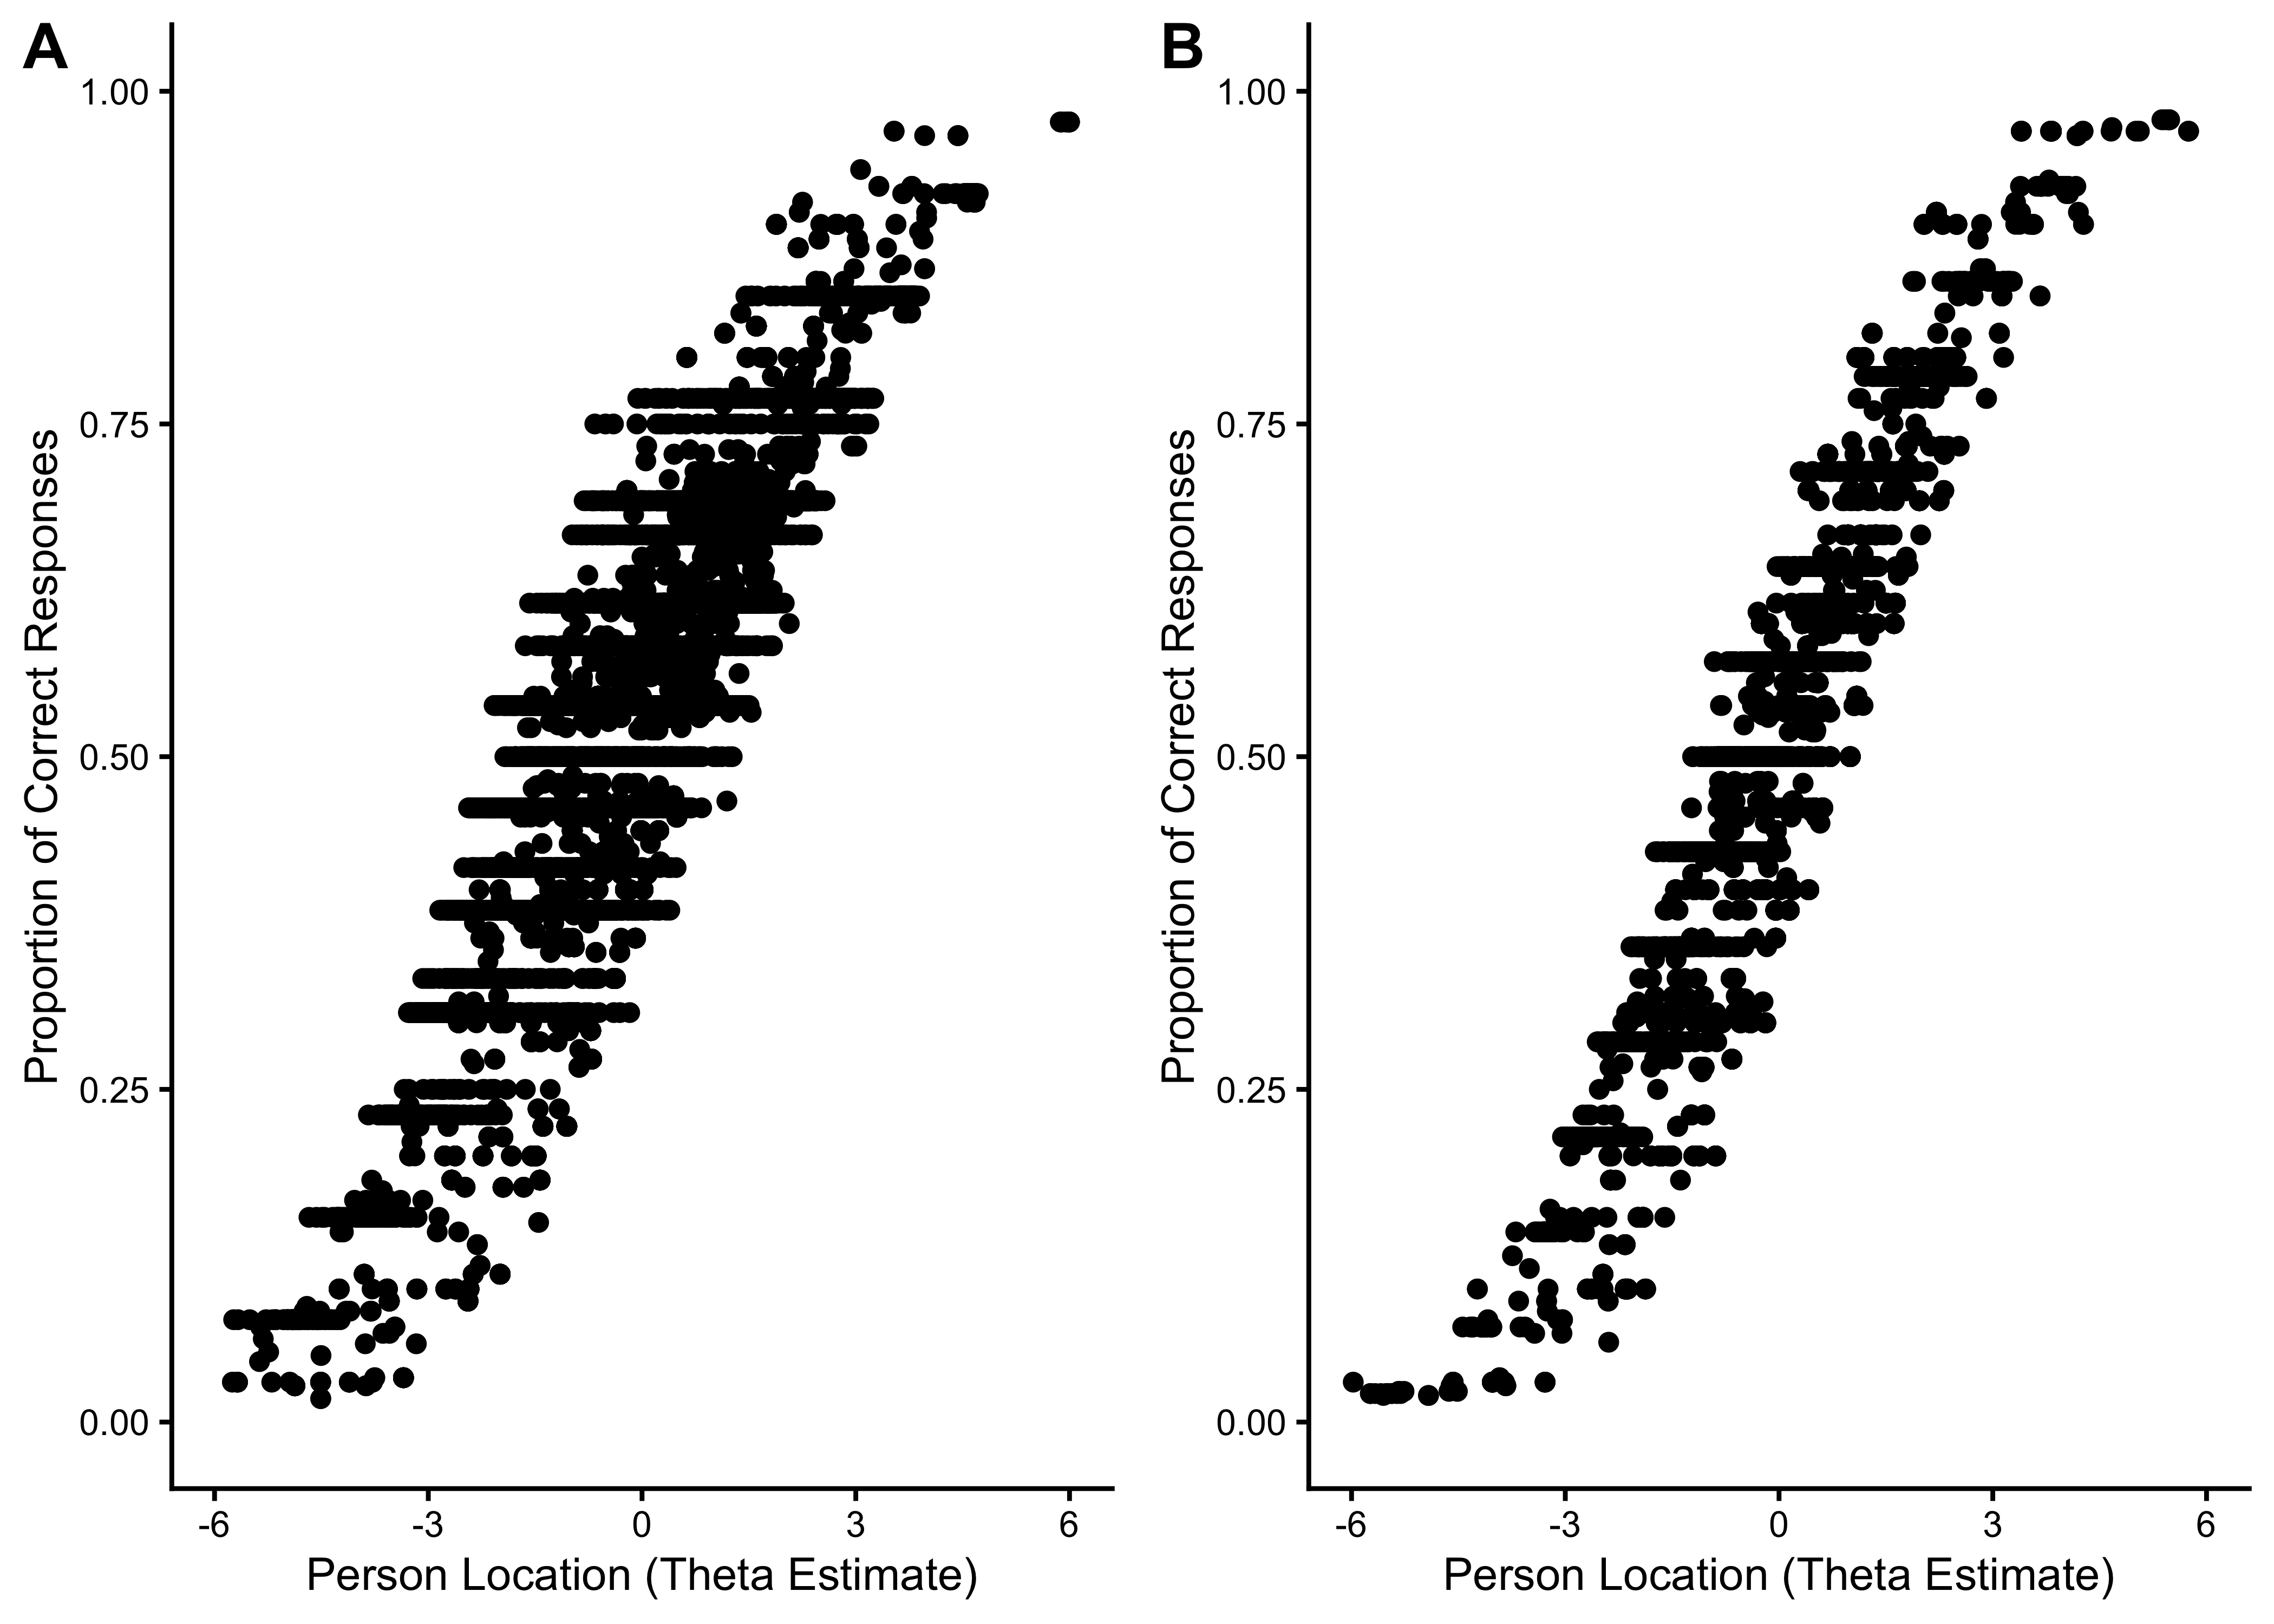
11.6.2.4 Person Fit Statistics
| A | B | C | D | Total | A | B | C | D | Total | |
|---|---|---|---|---|---|---|---|---|---|---|
| Outfit MSE | ||||||||||
| A | 5,932 | 0 | 41 | 0 | 5,973 | 2,434 | 0 | 13 | 1 | 2,448 |
| B | 921 | 319 | 0 | 0 | 1,240 | 375 | 233 | 0 | 0 | 608 |
| C | 205 | 0 | 86 | 3 | 294 | 107 | 0 | 40 | 3 | 150 |
| D | 141 | 0 | 83 | 28 | 252 | 58 | 0 | 48 | 6 | 112 |
| Total | 7,199 | 319 | 210 | 31 | 7,759 | 2,974 | 233 | 101 | 10 | 3,318 |
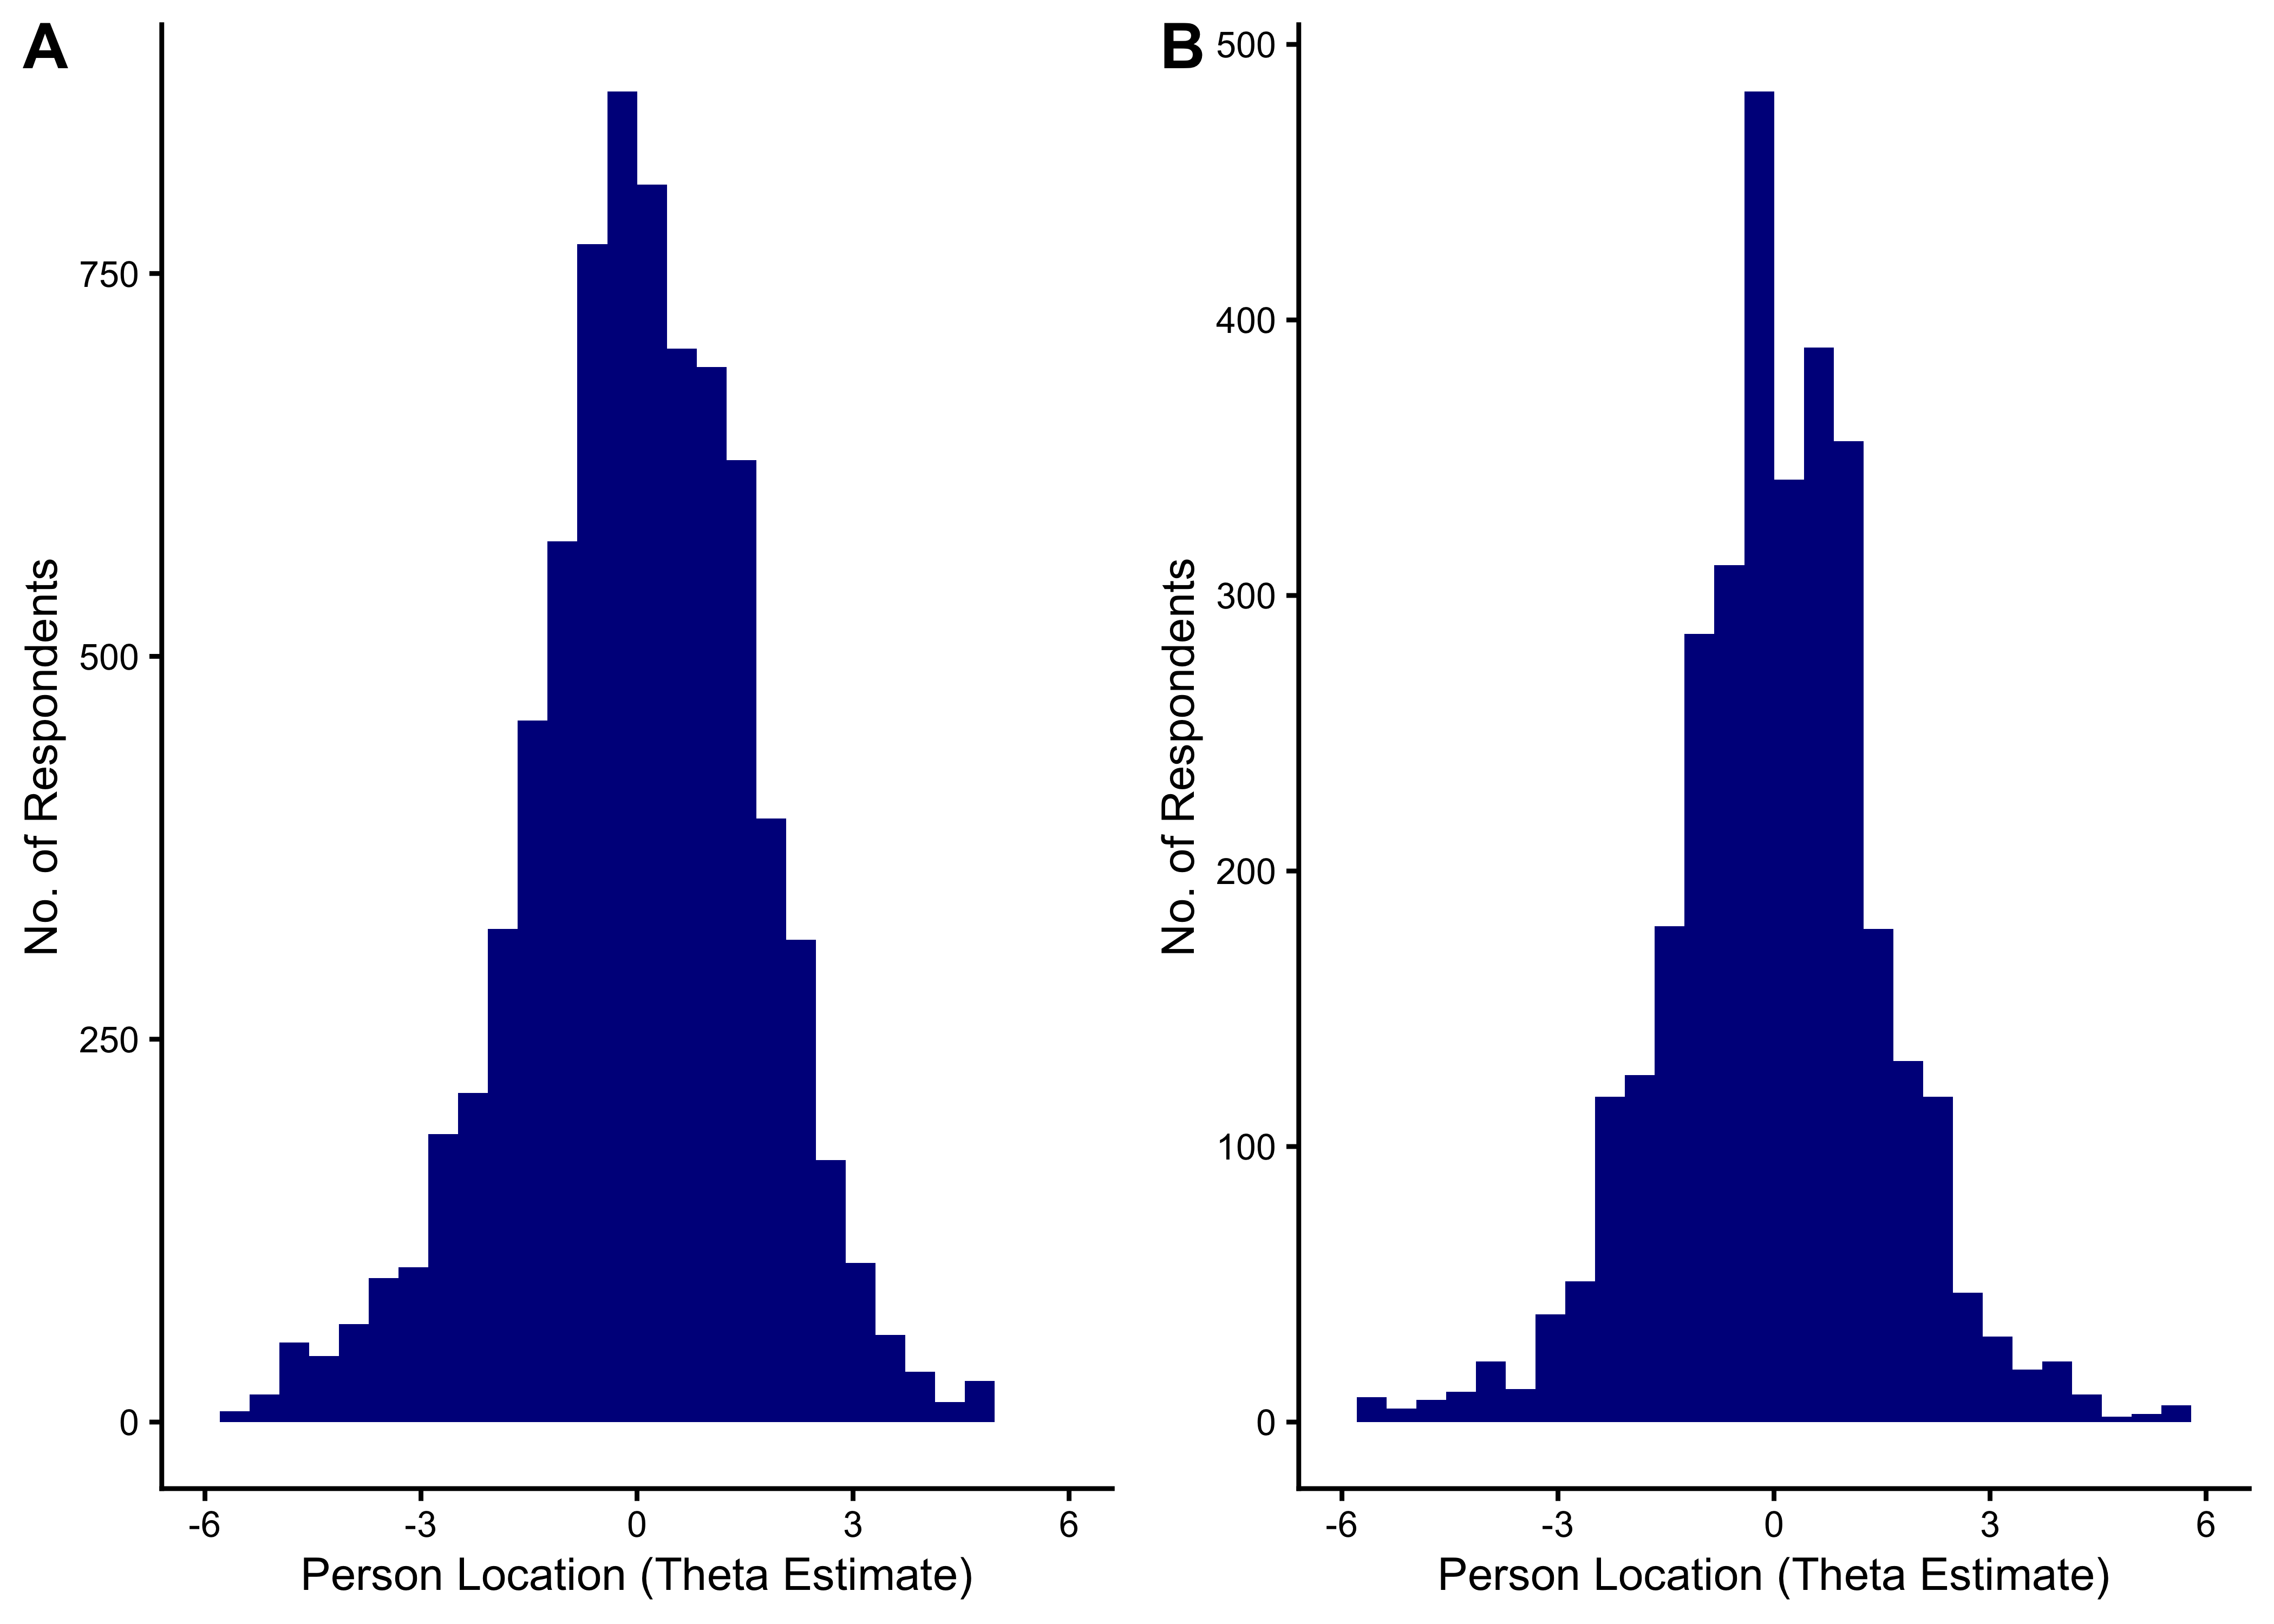
11.6.2.5 Distribution of Theta Estimates
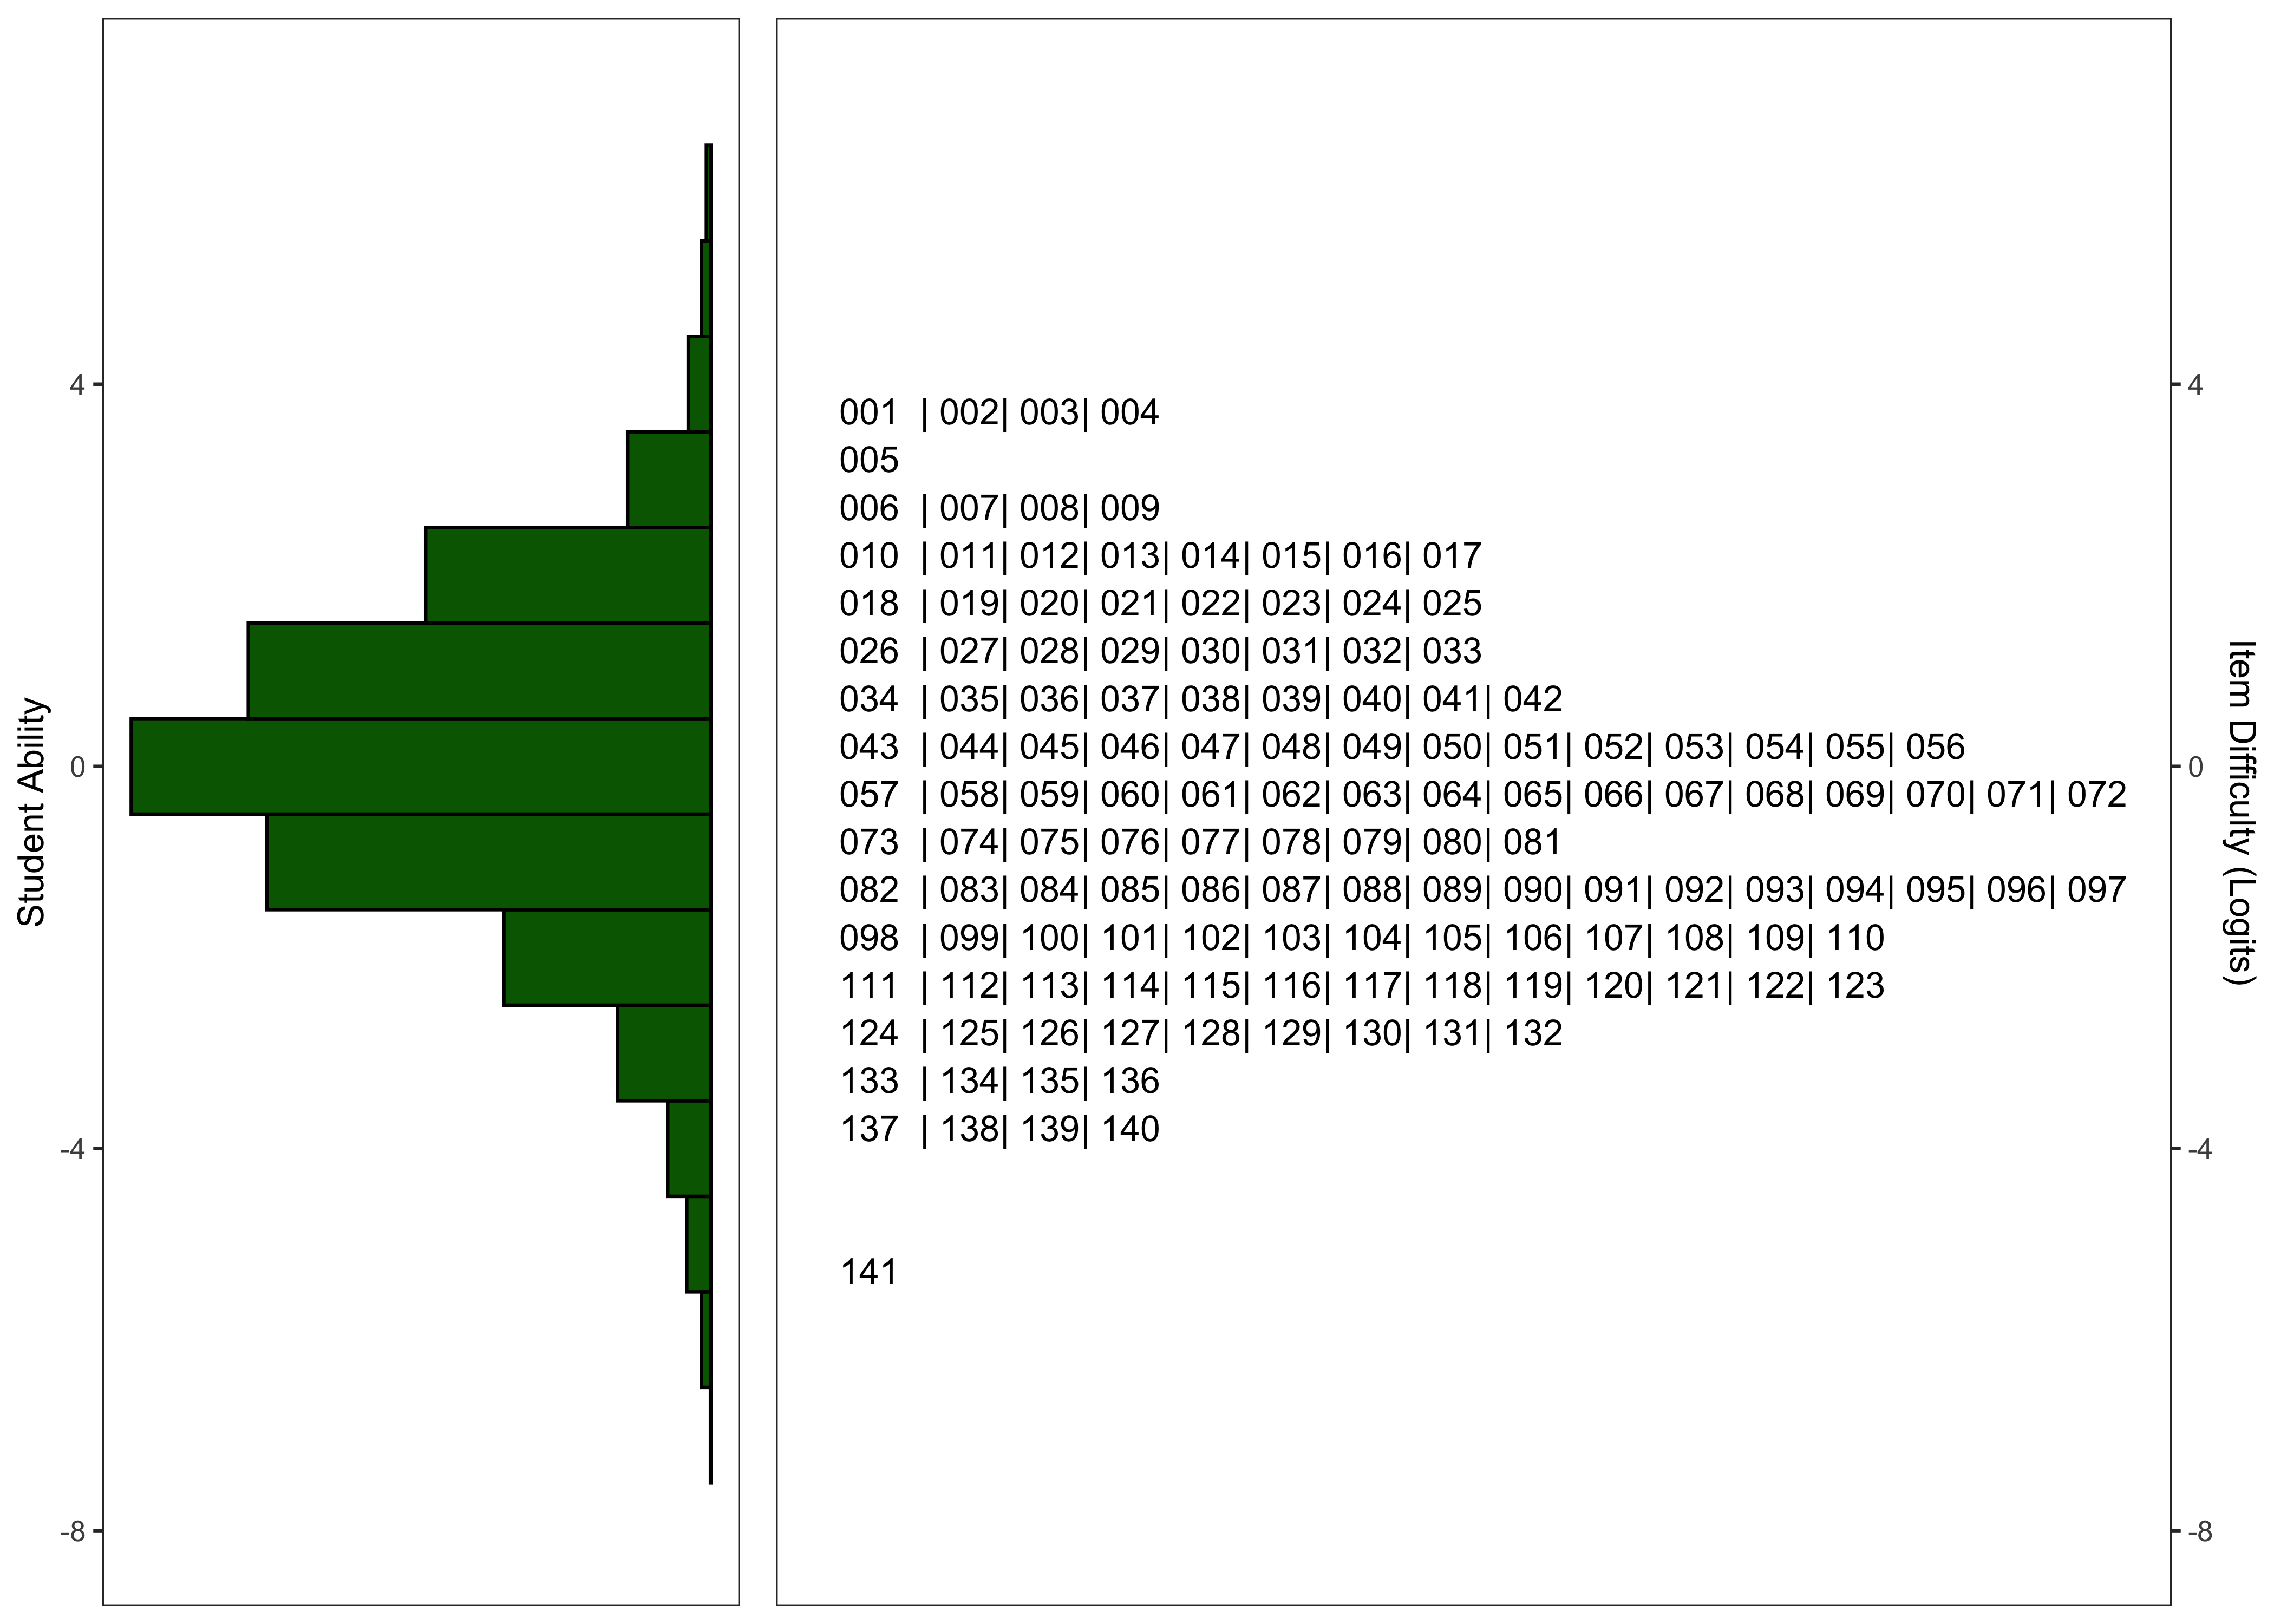
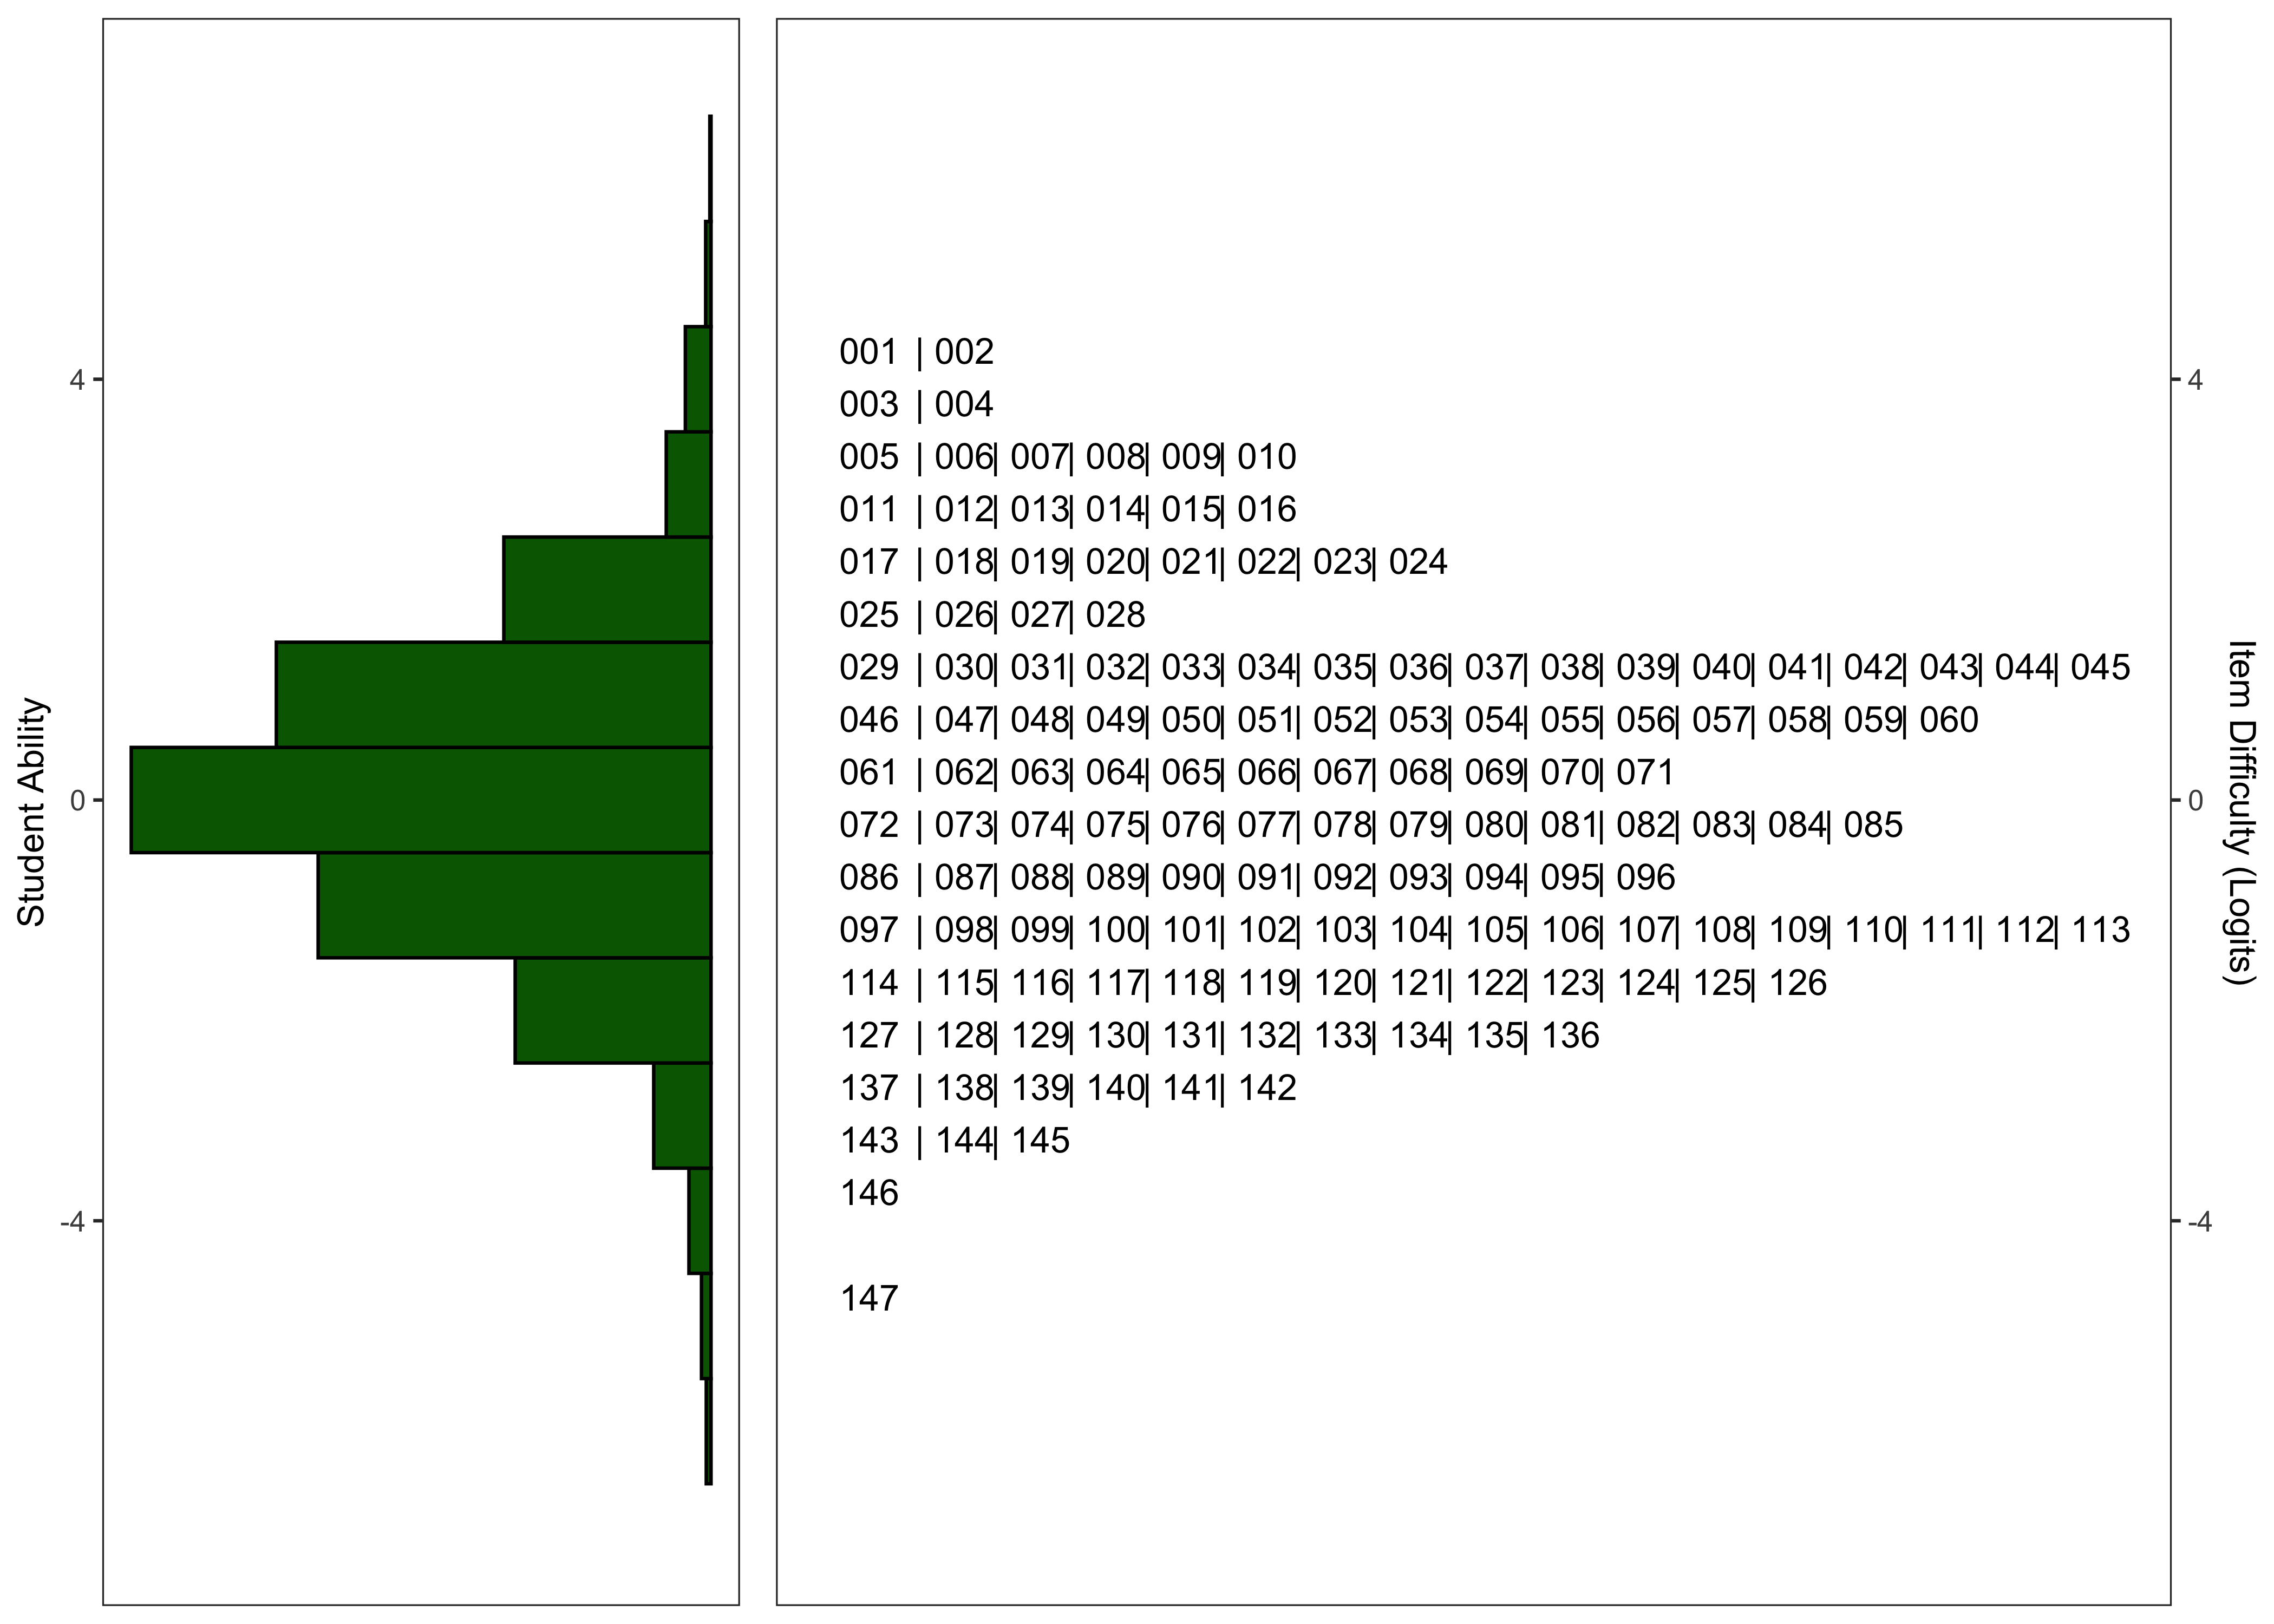
11.6.2.6 Wright Maps
11.6.2.7 Model Summary
| Characteristic | N = 141 | N = 7,759 | N = 147 | N = 3,318 |
|---|---|---|---|---|
| Logit Scale Location | -0.47 (1.88) | 0.03 (-0.98, 1.10) | 0.01 (1.84) | -0.01 (-0.89, 0.99) |
| Outfit | 1.02 (0.30) | 0.71 (0.56, 0.93) | 1.01 (0.22) | 0.77 (0.59, 0.96) |
| Infit | 0.98 (0.11) | 0.85 (0.71, 1.02) | 0.99 (0.08) | 0.87 (0.74, 1.02) |
| Reliability of Separation | 0.8292 | 0.8206 | 0.7708 | 0.7491 |
11.6.2.7.1 Final Number of Items
Following the exclusion of items with point-biserial correlations < .20 and items with poor fit statistics, the final versions of the task contain 141 and 147 for the English and Spanish task, respectively.
11.7 Criterion Validity Evidence
11.7.1 Sample
| Characteristic |
English
|
Spanish
|
||||
|---|---|---|---|---|---|---|
| K N = 262 |
G1 N = 231 |
G2 N = 204 |
K N = 240 |
G1 N = 225 |
G2 N = 265 |
|
| Timepoint | ||||||
| Winter 2024 | 262 (100%) | 231 (100%) | 204 (100%) | 240 (100%) | 225 (100%) | 265 (100%) |
| Race | ||||||
| American/Alaskan Native | 5 (1.9%) | 3 (1.3%) | 1 (0.5%) | 2 (0.8%) | 4 (1.8%) | 4 (1.5%) |
| Asian | 36 (14%) | 37 (16%) | 8 (4.3%) | 8 (3.4%) | 2 (0.9%) | 0 (0%) |
| Black/African American | 28 (11%) | 30 (13%) | 34 (18%) | 1 (0.4%) | 0 (0%) | 0 (0%) |
| Not reported | 30 (12%) | 32 (14%) | 13 (7.0%) | 132 (55%) | 153 (69%) | 172 (65%) |
| Other | 74 (29%) | 44 (19%) | 3 (1.6%) | 41 (17%) | 8 (3.6%) | 18 (6.8%) |
| White | 86 (33%) | 85 (37%) | 127 (68%) | 54 (23%) | 55 (25%) | 69 (26%) |
| Unknown | 3 | 0 | 18 | 2 | 3 | 2 |
| Ethnicity | ||||||
| Hispanic/Latin(o/a) | 106 (40%) | 96 (42%) | 121 (60%) | 217 (92%) | 209 (93%) | 248 (98%) |
| Intentional nonreport | 8 (3.1%) | 2 (0.9%) | 0 (0%) | 1 (0.4%) | 0 (0%) | 2 (0.8%) |
| Not Hispanic/Latin(o/a) | 148 (56%) | 133 (58%) | 82 (40%) | 19 (8.0%) | 16 (7.1%) | 2 (0.8%) |
| Unknown | 0 | 0 | 1 | 3 | 0 | 13 |
| Gender | ||||||
| Female | 132 (50%) | 106 (46%) | 98 (48%) | 126 (53%) | 110 (49%) | 137 (52%) |
| Male | 130 (50%) | 125 (54%) | 106 (52%) | 114 (48%) | 115 (51%) | 128 (48%) |
| Home Language | ||||||
| English | 190 (74%) | 172 (75%) | 128 (82%) | 29 (12%) | 23 (10%) | 23 (8.7%) |
| Spanish | 33 (13%) | 25 (11%) | 23 (15%) | 206 (87%) | 198 (89%) | 239 (91%) |
| Other | 34 (13%) | 33 (14%) | 5 (3.2%) | 2 (0.8%) | 1 (0.5%) | 1 (0.4%) |
| Unknown | 5 | 1 | 48 | 3 | 3 | 2 |
| English Proficiency Label | ||||||
| (Re-)Classified Proficient | 12 (5.5%) | 18 (8.0%) | 11 (7.1%) | 31 (14%) | 24 (11%) | 42 (17%) |
| English Learner | 50 (23%) | 41 (18%) | 17 (11%) | 184 (81%) | 176 (80%) | 178 (73%) |
| English-only | 155 (71%) | 167 (74%) | 128 (82%) | 11 (4.9%) | 19 (8.7%) | 23 (9.5%) |
| Unknown | 45 | 5 | 48 | 14 | 6 | 22 |
| Ever IEP/504 | 19 (9.4%) | 22 (12%) | 18 (12%) | 20 (9.5%) | 23 (11%) | 16 (12%) |
| Unknown | 59 | 50 | 48 | 30 | 14 | 127 |
English Expressive Vocabulary was correlated with the Expressive One-Word Picture Vocabulary Test, 4th Edition (Martin and Brownell 2011). Spanish Expressive Vocabulary was correlated with the Expressive One-Word Picture Vocabulary Test, 4th Edition, Bilingual Edition (Martin 2013).
| Grade | n | r [CI] | n | r [CI] | n | r [CI] |
|---|---|---|---|---|---|---|
| K | 262 | 0.75 [0.70, 0.80] | 50 | 0.70 [0.52, 0.82] | 240 | 0.59 [0.50, 0.67] |
| G1 | 231 | 0.76 [0.70, 0.81] | 41 | 0.80 [0.66, 0.89] | 225 | 0.51 [0.41, 0.60] |
| G2 | 204 | 0.72 [0.65, 0.78] | NA | NA | 265 | 0.48 [0.39, 0.57] |